In the first few years of my trading career, I traded solely off chart patterns and candlestick combinations and never knew there was an underlying road map to each chart I traded. A trader buddy of mine introduced me to the Floor Pivots and my trading world has never been the same.
Floor Pivots have been around for a long time and many traders have used these pivots to master the market for decades. In 1979, legendary trader Larry Williams repopularized the formula by including it in his book How I Made One Million Dollars Last Year Trading Commodities. Back in the days when computers were yet to be used on the floors of the exchanges, traders would use the formula as a simple way to forecast the day’s potential support and resistance levels.
In its simplest form, Floor Pivots are price-based support and resistance levels that are calculated using a prior period’s high, low, and close prices.
Once you plug in the high, low, and close prices of the prior day (or week, month, or year), the formula will automatically calculate the central pivot point, three resistance levels (R1 to R3), and three support levels (S1 to S3) that are to be used for the current day’s trading activity (or week, month, or year). The Standard Floor Pivots Formula is as follows:
R3 = R1 + (High – Low)R2 = Pivot + (High – Low)R1 = 2 × Pivot – LowPivot = (High + Low + Close)/3S1 = 2 × Pivot – HighS2 = Pivot – (High – Low)S3 = S1 – (High – Low)
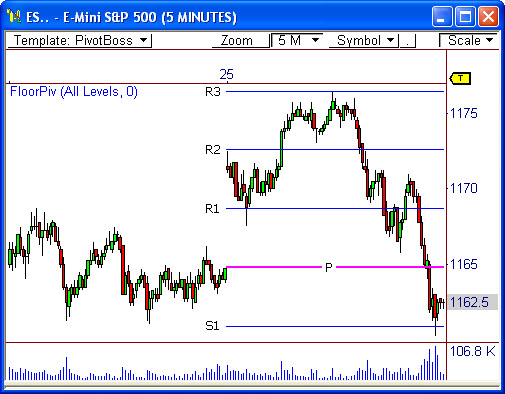
Take a look at the 5-minute chart of the E-Mini S&P 500 futures contract (ticker: ESM0) below. Every major price reversal on this day was dictated by the Floor Pivots. When the pivots can be this accurate, wouldn’t you want them on your charts?
The main reason these pivots can be so unbelievably accurate is the simple fact that market participants are watching and trading these key levels.
Trader psychology, and human nature for that matter, has remained the same for centuries due to fear, greed, hope, and uncertainty. These are the reasons why traders continue to react to key levels in the charts the same way over and over again. This is also the reason why these pivots have stood the test of time and will continue to work into the future.
Floor Pivots offer an amazing way to view the market. They are like night-vision goggles, illuminating the moves of the market even in the most uncertain of times. As you begin to study the pivots on a deeper level, you will begin to see the correlated nature between the Floor Pivots and price behavior.
The Floor Pivots have been amazing for my development as a trader. These levels helped pave the way to my discovering important forms of pivot analysis, including concepts like two-day pivot relationships, pivot width forecasting, pivot trend analysis, and multiple pivot hot zones, which I will cover in future blog posts.
I hope you enjoyed this crash course in Floor Pivots. This blog post is only the tip of the proverbial iceberg, as this information lays the foundation for forthcoming advanced topics.
Frank Ochoa
PivotBoss.com
Follow Frank on Twitter: http://twitter.com/PivotBoss


Pingback: To Break, or Not to Break? | PivotBoss.com
Pingback: Russell 2000, Meet Brick Wall | PivotBoss.com
I tried to join your mailing list and blog posts via e-mail and have received
no confirmation via e-mail. Help??
Thanks,
Sid
Hi Sid!
Thanks for subscribing! Sometimes Feedburner can take a while to send out confirmation emails, same with other hosts. I’ll keep an eye on it for you, but you should receive a confirmation today.
Talk to you soon!
Frank
Pingback: Look Familiar? | PivotBoss.com
Pingback: New to PivotBoss? Start Here! | PivotBoss