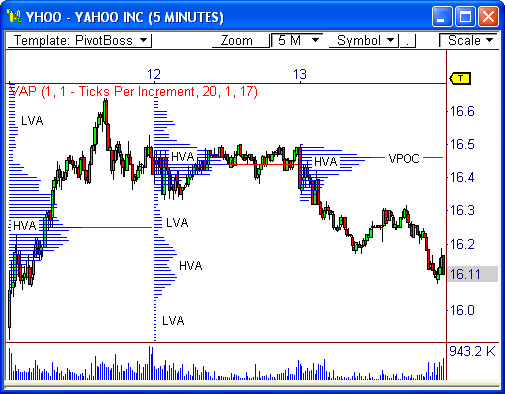
The Volume at Price indicator is a visually powerful tool. Plotting this indicator allows you to see the market at work in a way that no other indicator offers. Proper understanding of this tool can make you a more knowledgeable trader.
Understanding VAP
You’re familiar with how volume is normally plotted on a chart, right? Normally, volume information is displayed by showing the amount of volume traded over a certain period of time. Take a 5-minute chart, for example. Every volume bar that corresponds to a 5-minute bar shows the amount of volume that was traded during each 5-minute interval. Pretty easy, right?
Well, Volume at Price does it better.
The Volume at Price indicator divides volume equally across all price points that were reached during a specific period of time and then plots the information using a horizontal histogram directly onto the price chart. This is very similar to the Market Profile structure, but VAP is strictly volume-based, whereas MP is price-based. The display of information is actually quite attractive and allows you to quickly assess price points of interest, thereby highlighting potential areas of support and resistance, and areas where price may be considered at value, overvalued, or undervalued.
The VAP indicator uses the volume activity at a price from the prior session and overlays the histogram over price in the current session. Therefore, yesterday’s volume activity at a price is shown on today’s chart. This indicator can also be configured to display this information in real time as new information enters the market.
You may be asking yourself why this information is important, or even helpful. Why do we need to know where volume was traded yesterday in order to trade today? The answer is simple. In order to anticipate how the market will respond to a certain price level in the current session, you must understand how price reacted to that level in the recent past.
VAP Terms
1. Volume Point of Control (VPOC) – This level represents the price where the most volume was traded during a given period of time, thus representing the fairest price as seen through the eyes volume. VPOC is represented on the histogram as the longest horizontal line that stretches across the session. The Volume Point of Control and the price-based Point of Control (POC) will usually identify the same price level as the fairest value to traders, but this is not always the case.
2. High Volume Area (HVA) – Perhaps the most significant aspects of the Volume at Price indicator are the volume peaks, or High Volume Areas (HVA). These peaks visually highlight high traffic price levels where the most trade occurred between buyers and sellers. These peaks are extremely relevant in the charts because they signify price levels that offered fair facilitation of trade. As you know, the market solely operates to facilitate trade; therefore these peaks visually display satisfied customers. You will typically see price trade from one HVA to the next in order to accommodate trade facilitation.
3. Low Volume Area (LVA) – The volume valleys, or Low Volume Areas (LVA), can be quite important as well. You may see price easily push through a LVA in order to get to the next volume peak, which is considered an area where fair trade is conducted. Think of a LVA as a hallway that separates two rooms, which are the HVAs. People will freely and easily walk through the hallway to get to the rooms at either end. While people can stand and congregate in the hallway, they are more inclined to do business in either of the two rooms, which offer more convenience and can accommodate more people. Knowing where the LVAs are located will allow you to prepare for a potential price probe to the next HVA.
While this is an introductory look at how price can react to the Volume at Price indicator, it’s easy to tell that it can be a powerful complement to the way you trade and analyze the market. As we move forward, I will reveal powerful nuances behind the indicator that will help you trade in a more knowledgeable and profitable manner!
What are your experiences with VAP? Leave a comment!
Frank Ochoa
PivotBoss.com
Follow Frank on Twitter: http://twitter.com/PivotBoss


Pingback: $FAZ Headed to $12? | PivotBoss.com
Pingback: $BIDU Headed to $75? | PivotBoss.com
Pingback: What is VPOC (Volume Point of Control)? | TTG Trading