The major market indexes have been testing price levels below critical support areas over the last two days, but some indexes are beginning to show signs of life – including the Russell 2000 Index. The $RUT has high concentrations of support confluence that could lead to a big bounce in this index. Let’s take a look!
Channel and L3 Support
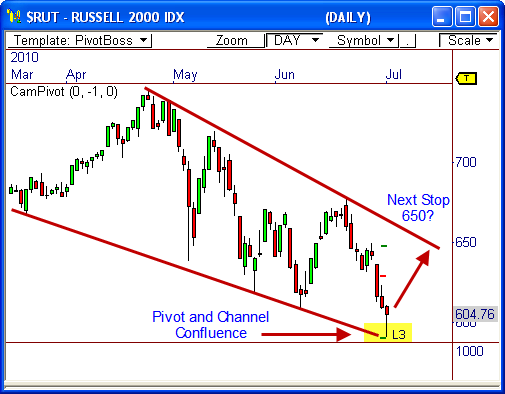
The Russell 2000 pushed below the 600 level for the first time since February, but immediately found buyers below this level, which lifted price late in the trading day.
What’s interesting about this bounce is the fact that price reversed off two important areas of support, which have formed a nice band of confluence.
First, the monthly L3 Camarilla level for July is at 590.30. Price reached a low of 590.57 yesterday before forming a bullish hammer candlestick at this level. This type of test and reversal early in the month can be a sign of a greater reversal ahead.
Second, the L3 Cam level also coincides with the bottom of a downtrending channel, which has formed since March. The $RUT has several touches along the bottom of this channel – with each test leading to a significant bounce in the index.
If price can remain above the 590 level, we could see a steady bounce back toward the top of the channel at around 650 over the next 5 to 10 trading sessions.
If you want a refresher on the Camarilla Indicator, read “The Camarilla Equation Explained”.
Yearly Pivot Support and 38% Fib Level
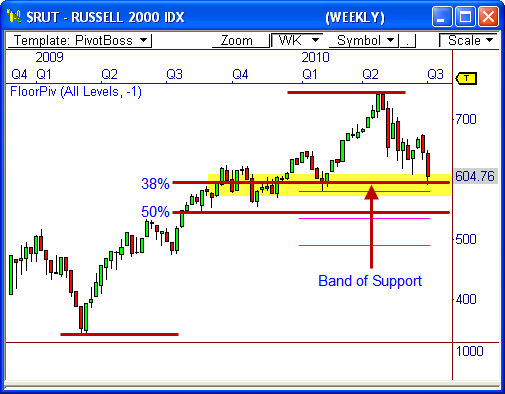
The weekly chart of the Russell 2000 shows the index continues to hold above the year’s low price of 580, which coincides with the top of the yearly central pivot range. As we know all too well, this range is a major band of support, especially when it’s support for the year.
The $RUT came within 10 points of testing this level before bouncing late yesterday afternoon. The bounce actually happened to coincide with the 38% Fibonacci Retracement level of 594.75, as measured from the 2009 low to the 2010 high.
The yearly pivot range and the 18-month Fib level form another powerful band of confluence that could provide a bullish boost for the index, thereby giving us multiple timeframe confirmation.
Of course, all of this begins to fall apart if the Russell 2000 closes below 580, as this could signal a drop to the next area of interest at 545, which coincides with the 50% Fib level.
If you want a refresher on the Pivot Range, read “A Quick Guide to the Pivot Range”.
We’ll see how this pans out…and of course, we’ll also see how the Non-Farm Payroll number plays into all of this shortly.
Cheers!
Frank Ochoa
PivotBoss.com
Follow Frank on Twitter: http://twitter.com/PivotBoss


