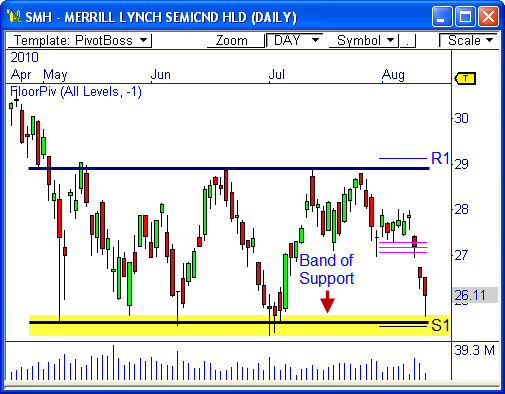
The Semiconductor ETF ($SMH) has been honoring the boundaries of a large trading range from $25.40 to $28.90 over the last four months, offering amazing reversal opportunities along the way. As a matter of fact, I wrote about once such opportunity on the actual $SOX Index on July 6, which worked out great! Now, it looks like another opportunity may be upon us..
Major Support
The daily chart of the $SMH shows price tested the lower band of support yesterday, which spans from $25.20 to $25.65. Each test along this support zone has led to beautiful rallies over the last few months.
Are we due for another rally? Or will the range finally be broken?
It’s hard to tell what the answer will be, but the intial buying pressure that was seen in this zone yesterday offers a bullish tone. If price can continue to hold above the monthly S1 support level at $25.43, there is a shot to bounce back to the pivot range, which spans from $27.05 to $27.28. However, rallying to the top of the range again seems like a long shot due to recent weakness in the overall market.
Narrow Value Area
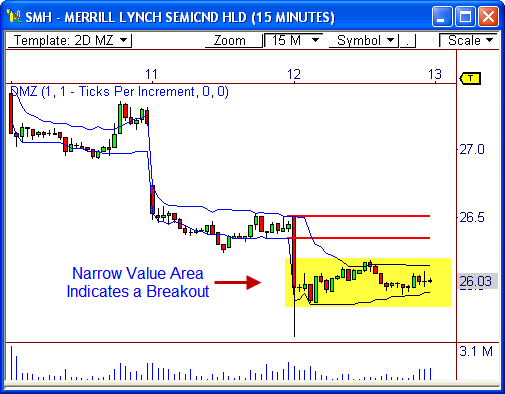
The 15-minute chart of the $SMH shows price is winding up for a potential breakout opportunity ahead. The value area for today’s session will be very narrow, which is usually indicative of a breakout opportunity.
However, there is a contradictory view here. The today’s value area will be below yesterday’s value area, which offers bearish sentiment. Therefore, a downside break could lead to a test at the important S1 support level at $25.43. A violation of this support could lead to a breakout from the range.
Watch the intraday range very closely, because it will likely give us the answer to our ‘break or bounce?’ question – $26.20 up, $25.85 down.
To read more about the value area – CLICK HERE!
Let’s see what happens!
Cheers!
Frank Ochoa
PivotBoss.com
Follow Frank on Twitter: http://twitter.com/PivotBoss


