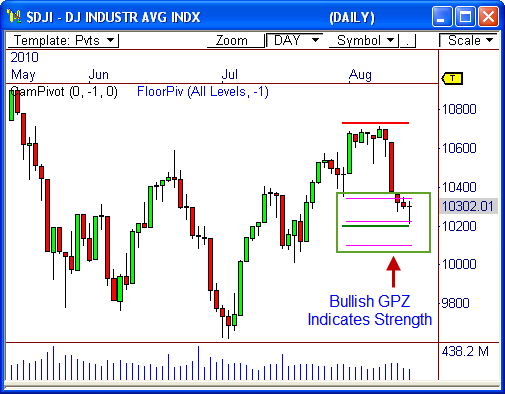
The Dow Jones Industrial Average ($DJI) has dropped over 500 points the last week of trading, but is beginning to show signs of strength. Here’s why I think we could see a rally ahead for the Dow.
Pivot-Based Support
The daily chart shows the Dow has dropped right into a major area of pivot-based support, which I call the Golden Pivot Zone (GPZ). A bullish GPZ forms when the L3 Camarilla level is found within the boundaries of the pivot range. During an uptrend, any pull-back to this area of confluence is seen as a buying opportunity.
As you can see, buyers entered the market en masse yesterday when price approached the center of the GPZ, as price tested the monthly pivot point and then reversed for a 100-point rally to finish the day.
If buyers continue to find value in this area, we could see a short term rally back toward 10,600.
Bullish Hammer
The daily chart also shows price has formed a bullish hammer candlestick pattern after testing the GPZ. This candlestick offers visual confirmation that responsive buyers are indeed entering the market. Also, this type of pattern has a habit of forming at the extremes of trends – just look at the top in June!
If we see a close above the high of the hammer at 10,335, we could have enough confirmation to ride the move back toward 10,600 – and potentially higher! This form of confirmation is important. Otherwise, a failure back below 10,200 will indicate more selling pressure ahead.
Let’s see what happens!
Cheers!
Frank Ochoa
PivotBoss.com
Follow Frank on Twitter: http://twitter.com/PivotBoss

