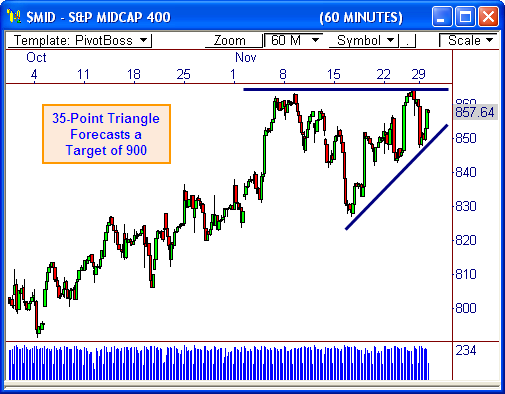
The S&P MidCap 400 Index ($MID) has traded within a relatively quiet range throughout the month of November – but this range could spark the next major breakout opportunity! Read More..
Ascending Triangle
The 60-minute chart shows the $MID has developed a clear ascending triangle pattern over the last four weeks of trading. The back end of the pattern spans about 35 points, which means an eventual breakout could spark the next 35-point move in this index!
Ascending patterns tend to break to the upside, so this pattern paints a bullish picture for this index. A breakout through the top of the pattern at 865 forecasts a target of 900, which could be a very profitable move for those trading the EMD futures contract.
Since this triangle could break in either direction, keep an eye on 847 down, and 865 up. Eventually, a breakout could ignite a major move in the direction of the break – so watch this pattern closely.
Let’s see how this pattern plays out!
Cheers!
Frank Ochoa
PivotBoss.com
Follow Frank on Twitter: http://twitter.com/PivotBoss


This arilcte is a home run, pure and simple!