The S&P 500 is clearly winding up for the next major market phase, as indicated by the massive triangle that continues to develop. Here’s more..
280-Point Triangle
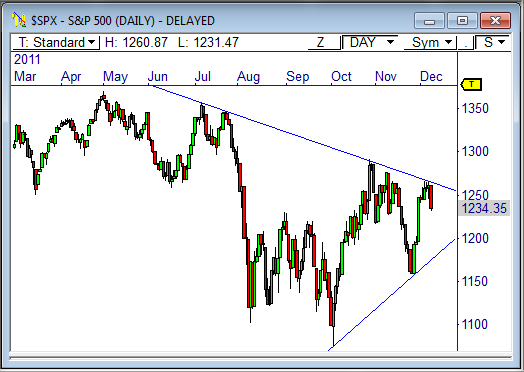
The daily chart of the S&P 500 shows the index has been developing a large, symmetrical triangle over the last 9 months. This triangle measures 280 points, which means a breakout could lead to a move of about 280 points.
We will continue to watch both the upper and lower trend lines of the pattern for a potential violation. While these lines will dynamically update, the current levels to watch are: 1,270 up; 1,155 down.
Weekly Chart
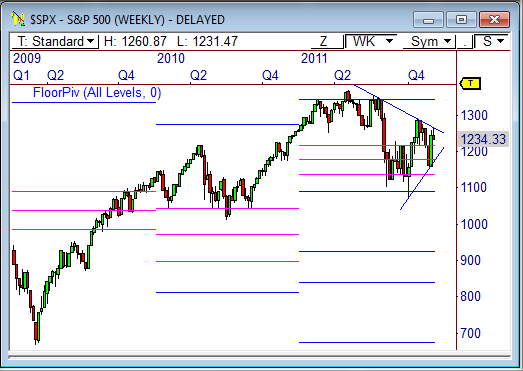
The weekly chart of the last three years shows price has continued to trend higher after the 2009 lows, and continues to honor important pivot-based support.
Once price closed above the yearly pivot range (the three pink lines) to end the year in 2009, price has held above the pivot range each of the last two years, which honors the rules of pivot-based trend analysis. Every pull-back to the pivot range in a bullish trending market becomes a buying opportunity.
So far, buyers have defended the pivot range over the last two years.
The 280-point triangle is developing above the 2011 yearly pivot range, which is very bullish for long term direction. If price continues to hold above the pivot range, and especially above the S1 support level of 1,091.50, we could see a major rally toward 1,550 over the next 6 to 9 months.
If price breaks the triangle pattern to the downside, and violates the 1,100 level, this index could be in trouble, as a target of about 875 could be seen.
Which will it be?
I’m bullish on this pattern, but let the market decide direction, then jump along for the ride.
Cheers!
Frank Ochoa
PivotBoss.com
Follow Frank on Twitter: http://twitter.com/PivotBoss


