The S&P 500 has experienced its largest retracement of the year thus far, as the index has dropped from 1,420 to 1,360 in a brief 5-day span. Will the smart money see this as a buying opportunity, or as a change in trend? Here are my thoughts..
Weekly Chart
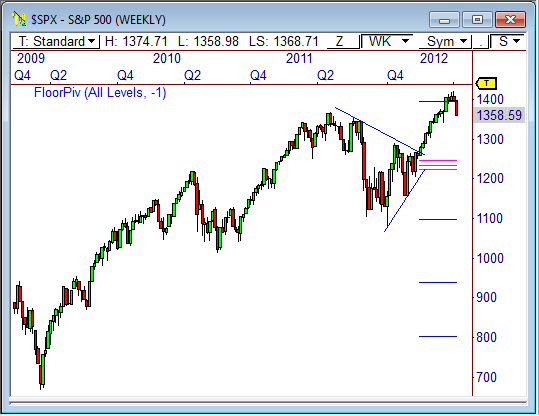
The weekly chart of the S&P 500 shows the current pull-back has been relatively modest thus far. We’re talking about a 65-point pull-back after a rally of more than 165 points year-to-date, and about 265 points since the current rally began late last November.
In essence, more must be seen before we can declare the current bull trend dead.
The large triangle pattern with the narrow pivot range that I wrote about to begin the year continues to produce. The fact that the index sprinted out of this pattern is indicative of decisive strength. Strength that is led by powers that are not likely to relinquish control without a fight.
As a matter of fact, the current pull-back may indeed be much healthier for the overall bull trend, as the market has not had a decent retracement all year. Buying begets buying, and pull-backs beget buying, too.
Simply put, this pull-back could be seen as a buying opportunity by the smart money.
Daily Chart
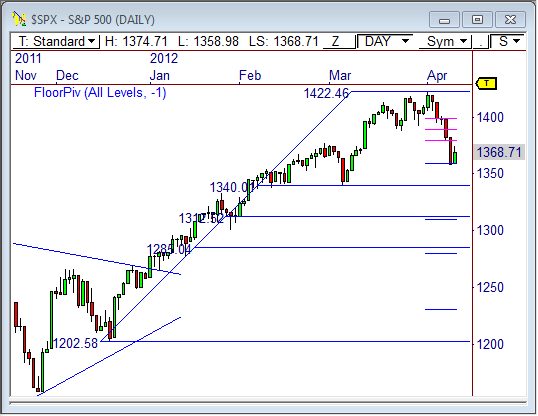
The daily chart shows the $SPX is currently testing the monthly S1 support level of the Floor Pivots. This is the first such test at a monthly S1 pivot since last year (the October bottom), which further demonstrates how bullish this index has been.
Markets trend to remain above S1 in strong bull trends, and below R1 in strong bear trends. Therefore, if the $SPX continues to hold above S1 at 1,359 we should see responsive buyers enter the market, which could lead to another round of strength ahead.
However, if 1,359 is clearly breached, expect a test to occur at 1,340, which is the next key area of visual support. This level would also represent the 38% Fibonacci retracement from the December low to the April high.
If price tests 1,340 and holds, we could see a period of compression, as the market “rests” between 1,340 and 1,420 ahead of the next phase of range expansion, whether up or down.
15-Minute Chart
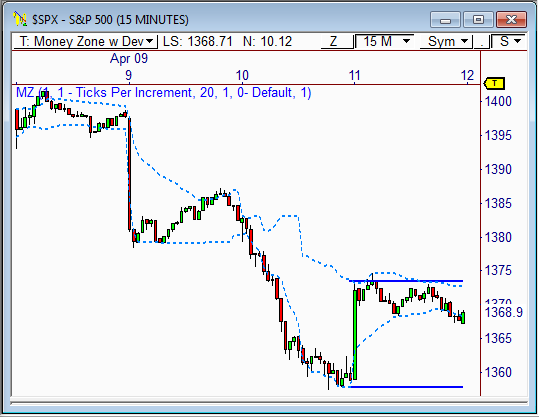
While today’s market activity was perfectly in line with what usually occurs after a trend day (sideways; digestion), tomorrow could provide another burst of price movement.
The 15-minute chart shows today’s Value Area was quite wide due to yesterday’s bearish trend day. A wide VA usually results in sideways price activity, which clearly occurred today. Interestingly, today’s sideways move has led to a rather narrow Value Area for tomorrow’s market, which forecasts a potential breakout opportunity.
If the market opens the session with a gap outside of Wednesday’s price range, we could see a steady move in the direction of the break. Watch 1,365 for signs of continued weakness, and 1,375 for strength tomorrow
Developing the Professional Mindset
 Check out my new course Developing the Professional Mindset! This course is designed to re-wire your brain to view and analyze the market though the eyes of a professional trader.
In essence, DPM helps lay a proper foundation of trading principles that all traders must have in order to succeed in the markets.
Take a look, and tell me what you think!
Recent Break
I appreciate your patience and understanding regarding my recent absence. We just sold our home of 10 years, we’re signing to buy our next home in 2 days, and are awaiting our second baby girl in about 20 days time…busy with family doesn’t begin to explain it.
I’m chomping at the bit to get back to my daily market routine…but my family comes first.
I’m definitely looking forward to getting back soon!
Cheers!
Frank Ochoa
PivotBoss | Own the Market
Follow Frank on Twitter: http://twitter.com/PivotBoss


