The S&P MidCap 400 looks poised for a major breakout ahead – one that could be felt through the end of the year and beyond. Here’s more…
Massive Triangle
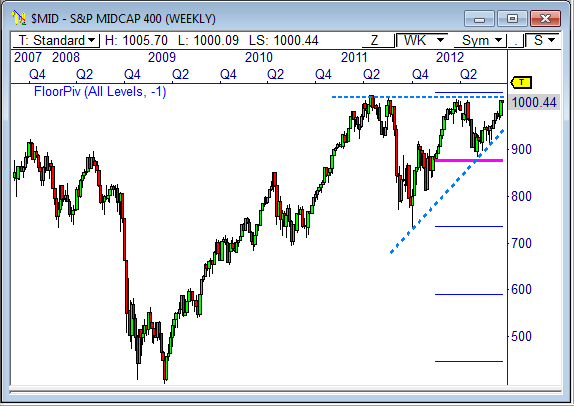
The weekly chart of the S&P 400 Index shows price has been winding up within the boundaries of a large developing triangle pattern since Q4 of 2010.
This ascending triangle pattern could be the spark that leads to the next major breakout in this index, which speaks volumes about the broader market, as well.
Most of the major market indexes have formed similar patterns, or are butting right up to long term resistance, so a breakout in this index could correspond very well with breakouts across the market.
Bullish Break Expected
Ascending patterns typically break to the upside, so we’ll be watching resistance very closely for signs of a bullish violation ahead. Moreover, the pattern has formed at the overall highs of the recent four-year uptrend, which is also quite bullish.
Keep in mind, while I am bullish on this pattern, a breakout in either direction should spark aggressive initiative participation, so keep an eye on both sides of the triangle, as a breakout in either direction will certainly pack some punch.
Targets
Since the backend of the pattern measures 287 points, we can expect a move of about the same size once a breakout occurs. That is, look for the market to move about 287 points in the direction of the break, which after Monday’s close amounts to a 28% move.
Watch the 2011 high at 1018.65 for signs of a bullish breakout. Since the yearly R1 Floor pivot is 1021.3, we’ll definitely want price to clear this hurdle, as well. The Bull target looks to be around 1,305, which actually corresponds well with the yearly R3 pivot.
For a bearish break, look for a violation through 880, with additional confirmation through the bottom of the yearly pivot range at 875. The Bear target forecasts to about 595, which looks to be the yearly S2 pivot.
Given the duration of the development of the triangle, the resulting breakout could span between 6 and 12 months, so we could be in for quite a trend ahead.
Let’s see how this plays out long term!
Speaking Engagement!
 I’ll be speaking for the Austin Association of Financial Traders (AAFT) in Austin this Tuesday! Come out and see me!
I’m ditching the typical presentation slides in favor of live analysis in front of the audience – so this should be fun!
To learn more about the meeting details, visit http://pivotboss.com/2012/09/07/live-analysis-for-aaft/.
I hope to see you tomorrow!
Cheers!
Frank Ochoa
PivotBoss | Own the Market
Follow us on Twitter: http://twitter.com/PivotBoss
[cc_list_posts post_type=”post” amount=”3″ img_position=”left”]


