The E-Mini NASDAQ 100 was not able to sustain the bullish breakout Monday morning, which led to weakness the rest of the session. Here are five reasons why the NQ is likely headed lower in the days ahead.
1. Rejection at Resistance
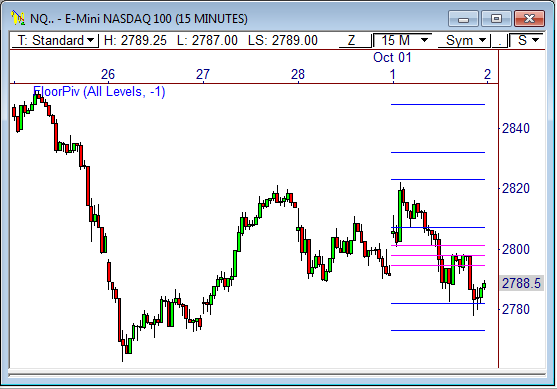
Today’s intraday rejection at the 2,820 resistance level tells us a lot about where the NQ might be headed in the near term.
The 15-minute chart of the NQ shows price opened the session with initial strength via a gap up and rallied to 2,820 before being rejected at visual resistance and the R2 floor pivot. Not just rejected…smacked down!
This rejection sent the index into a steady sell-off the rest of the session, which essentially sets up the rest of the reasons on the list.
Which brings us to..
2. Failed Inside Day
While the rejection from above is bearish enough, it is amplified when it occurs on the heals of an Inside Day formation. You see, the Inside Day pattern lends itself to major breakouts and follow-through, which didn’t occur Monday.
What does this mean? It means initiative bulls did not take the reigns and advance price higher, which is a HUGE tell for the bears.
The fact that the Inside Day pattern was not enough to fuel strength after the initial push higher is indicative of potential weakness ahead.
3. Bearish Outside Day
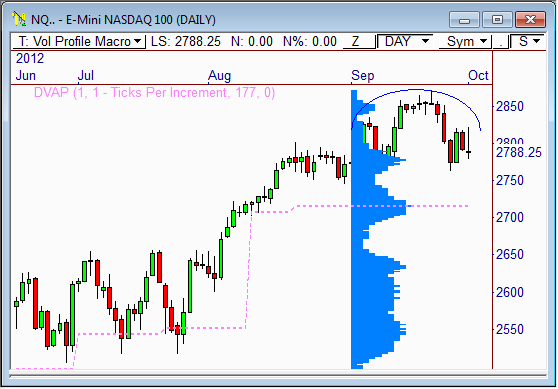
The daily chart shows the NQ formed a bearish outside day pattern after Monday’s session. An outside day pattern develops when the current session’s range engulfs the prior day’s range.
What makes this outside day pattern more significant is the fact that it opened below the prior day’s low, rallied to create a new high above the prior day’s high, and then closed back below Friday’s low. Essentially, this price behavior formed a very bearish reversal wick candlestick, which further signifies weakness ahead.
4. Rounded Top
The daily chart also shows that price is currently developing a rounded top pattern, which has been forming over the last four to six weeks.
This type of pattern usually precedes weakness, especially if the NQ remains below the 2,825 level that rejected its advances Monday morning.
5. VPOC at 2,715
Given all of the bearish cues, we’ll keep our eye on the 2,715 level as the near term target ahead. Why? Because it’s the composite volume profile’s Volume Point of Control, which tends to behave as a magnet.
The daily chart shows the 177-day volume profile, which clearly shows the 2,715 level. If price does indeed push lower, look for VPOC to serve as a target for bears looking to cash in on the positions.
The good news? The NQ has trended higher recently, which makes any pull-back to VPOC a buying opportunity. Look for buyers to enter the market 2,715 should a test occur.
If not, we could see tests at 2,670 and 2,635 ahead.
And don’t forget, if you buy my book in October, you’ll receive a free live webinar by yours truly in November! Read more…
Let’s see how this one plays out!
Cheers!
Frank Ochoa
PivotBoss | Own the Market
Follow us on Twitter: http://twitter.com/PivotBoss
[cc_h_line color=”888888″]
[cc_list_posts post_type=”post” amount=”3″ img_position=”left”]


