E-Mini S&P 500
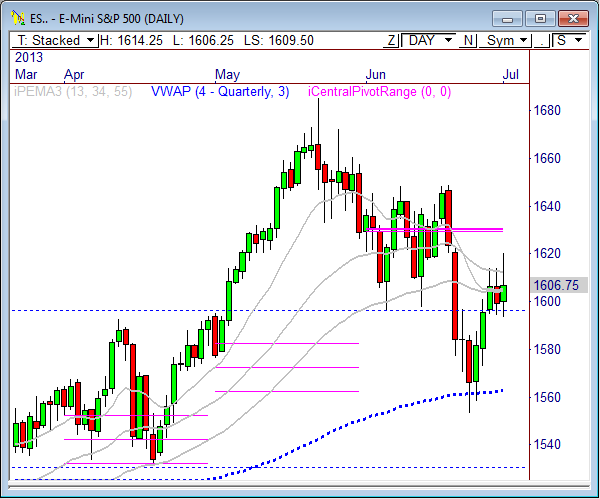
The E-Mini S&P 500 saw some fairly impressive price movement early and late in yesterday’s session. I’d expect that to quiet down quite a bit heading into today’s session, but early movement could be seen.
Overall, the ES has had a very impressive relief rally after setting a low of 1553.25 early last week. However, there are signs that the relief is now exhausted. Yesterday’s sharp turnaround indicates a likely pull-back from current levels, but the first major line in the sand will be 1595. A break below this zone could lead to a move back toward the midpoint of last week’s range, which is currently 1583.75.
For Today’s Market
In yesterday’s ES report I wrote, “If price breaks through 1610 early in the session watch 1614.50 as resistance. A break beyond this zone could spark a fill of the gap at 1622.75.”
The ES opened the session with early strength via a gap up yesterday morning and got an early break through the 1610 resistance level, which unleashed an unexpected rip of strength up to 1620.50 and falling just shy of filling the overhead gap of 1622.75.
Prices turned south and closed the session on lows, which was quite a departure from the day’s early strength. There is an unfilled gap down below to target at 1598, which may see some action today. Also, key support at 1595 continues to play a big role in recent weeks, so keep an eye on our primary bear target of 1595.50.
Any push into the 1611 to 1613.25 zone could be a selling opportunity early on. If price breaks and holds above 1613.25, we could see a run to a fill of the gap at 1622.75.
Since we’ll likely see quiet a bit of pre-holiday trading today, look to play to quick profit targets.
Watch these key economic reports for today’s price action:
9:00am CT: Factory Orders m/m
11:30am CT: FOMC Member Dudley Speaks
Here are the Key Levels and Targets for the current session and the week ahead:
| PivotBoss Levels & Targets: E-Mini S&P 500 (ES) | |||||
| Jul 2, 2013 | |||||
| KEY LEVELS | ADR TARGETS | ||||
| 1,643.50 | nVPOC | ADR (5) | ONH | ONL | |
| 1,626.00 | Fib Ext | 25 | 1,614.25 | 1,606.25 | |
| 1,622.75 | Open Gap | AWR (10) | WH | WL | |
| 1,620.50 | PD High | 68.25 | 1,620.50 | 1,593.25 | |
| 1,618.25 | VPOC | ||||
| 1,616.00 | LVN | DAILY TARGETS | WEEKLY TARGETS | ||
| 1,611.00 | Pivot | BULL | BEAR | BULL | BEAR |
| 1,607.50 | cVPOC | 1,618.75 | 1,601.75 | 1,644.44 | 1,569.31 |
| 1,606.50 | SETTLE | 1,625.00 | 1,595.50 | 1,661.50 | 1,552.25 |
| 1,606.00 | PD Low | 1,631.25 | 1,589.25 | ||
| 1,600.50 | Fib Ext | 1,637.50 | 1,583.00 | ||
| 1,598.00 | Open Gap | *BOLD indicates primary objectives | |||
| 1,597.25 | HVN | ||||
| 1,588.25 | LVN | ||||
| 1,581.50 | nVPOC | ||||
| 1,570.25 | LVN | ||||
E-Mini NASDAQ 100
In Friday’s NQ report I wrote, “if price opens today’s session with a large gap beyond one of the primary daily targets below, take half of the day’s ADR and project it higher and lower from the day’s open price to identify short term bull and bear targets.”
On a day when price gaps beyond one of the day’s primary bull or bear targets, you want to adjust your short term targets to reflect current price action. The quickest and easiest method is to take half of the day’s Average Daily Range (ADR) and project it higher and lower from the day’s open price.
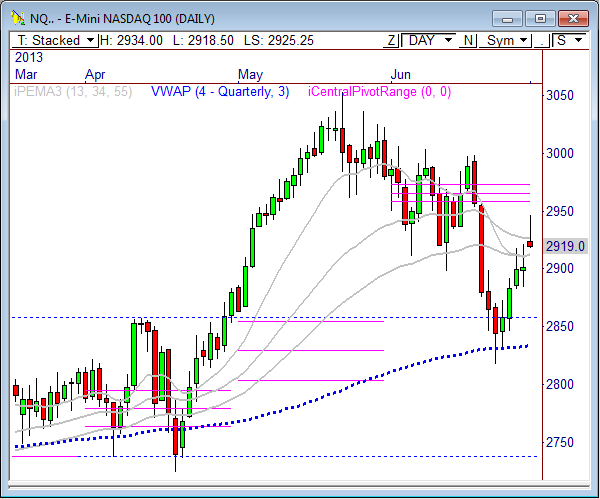
With yesterday’s big gap up, we were able to use this strategy to identify a highly reliable upside target, which was 2945.25. I call this the Gap Adjusted ADR target. As you’ll note, the high of the day was 2946.75, so our GA Target fell within 6 ticks of the high.
Here’s the math: (ADR x .5) + Open = GA BULL; Open – (ADR x .5) = GA BEAR
Yesterday’s ADR value was 43.25 (I mistyped the ADR in yesterday’s table), so half is 21.50 (rounded down). Adding 21.50 to yesterday’s open price of 2923.75 gives you a target of 2945.25.
The daily chart shows the NQ is beginning to show signs of weakness short term. I believe 2,910 is a level to watch for short term bias. A break back below this level opens the door to another test at 2900.
For today’s trading, watch 2928.25 to 2932 for signs of early weakness. Any selling in this area could lead to another round of weakness into the open gap. If price can break and hold above 2932, more strength could be seen toward 2950.75.
Here are the targets for the current session and the week ahead:
| PivotBoss Levels & Targets: E-Mini NASDAQ 100 (NQ) | |||||
| Jul 2, 2013 | |||||
| KEY LEVELS | ADR TARGETS | ||||
| 2,986.25 | nVPOC | ADR (5) | ONH | ONL | |
| 2,957.75 | Fib Ext | 43.25 | 2,934.00 | 2,918.25 | |
| 2,956.25 | Open Gap | AWR (10) | WH | WL | |
| 2,950.75 | LVN | 127.50 | 2,946.75 | 2,917.50 | |
| 2,946.75 | PD High | ||||
| 2,938.25 | VPOC | DAILY TARGETS | WEEKLY TARGETS | ||
| 2,933.00 | LVN | BULL | BEAR | BULL | BEAR |
| 2,977.75 | Pivot | 2,939.88 | 2,912.38 | 3,013.13 | 2,851.13 |
| 2,919.00 | SETTLE | 2,950.69 | 2,901.56 | 3,045.00 | 2,819.25 |
| 2,917.50 | PD Low | 2,961.50 | 2,890.75 | ||
| 2,908.50 | cVPOC | 2,972.31 | 2,879.94 | ||
| 2,907.00 | nVPOC | *BOLD indicates primary objectives | |||
| 2,906.50 | Fib Ext | ||||
| 2,902.00 | Open Gap | ||||
| 2,898.00 | LVN | ||||
| 2,855.50 | nVPOC | ||||
| 2,832.25 | nVPOC | ||||
Crude Oil
In yesterday’s Crude report I wrote, “Guess where the current overnight low is? (A: the top of the monthly pivot range at 96.07) We could see price drop into this range for an early test this morning. If prices are defended, we are headed higher…Watch today’s daily bull and bear targets: 97.55 and 95.82.”
Crude Oil wasted no time getting a test of the top of the monthly pivot range at 96.07, which was defended by the bulls and opened the door to higher prices. Crude rallied to our daily bull target of 97.55 and even hit the full ADR target of 98.04.
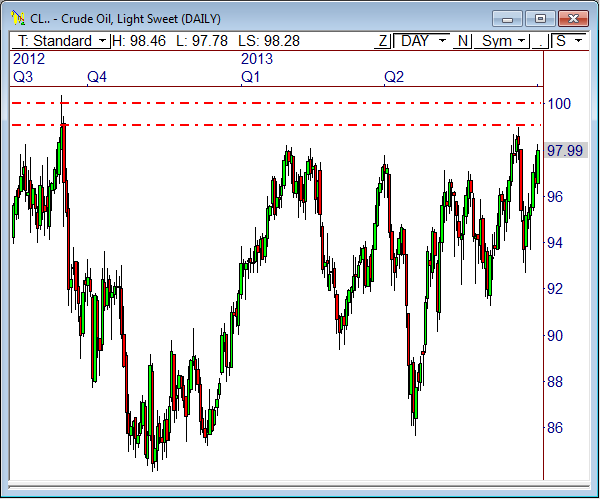
Crude continues to hold above the 96 spot, which is the major line in the sand. With a current overnight high of 98.46, it appears clear we are headed toward another test at prior highs at 99.01. The daily chart shows the 99 to 100 level has been firm resistance since breaking below this price zone in May 2012. Breaking this level will be a very tough task in the near term. But once broken, it could open the door to 105 and 110 above.
With the last full trading day before holiday-shortened trading, look to play to the near-term targets of 98.72 and 97.53.
Here are the targets for the current session and the week ahead:
| PivotBoss Levels & Targets: Crude Oil (CL) | |||||
| Jul 2, 2013 | |||||
| KEY LEVELS | ADR TARGETS | ||||
| 99.01 | LVN | ADR (5) | ONH | ONL | |
| 98.65 | Fib Ext | 1.87 | 98.46 | 97.78 | |
| 98.60 | nVPOC | AWR (10) | WH | WL | |
| 98.48 | Open Gap | 5.09 | 98.28 | 96.07 | |
| 98.28 | PD High | ||||
| 98.04 | SETTLE | DAILY TARGETS | WEEKLY TARGETS | ||
| 97.94 | VPOC | BULL | BEAR | BULL | BEAR |
| 97.29 | PD Low | 98.72 | 97.53 | 99.89 | 94.46 |
| 97.15 | vPOC | 99.18 | 97.06 | 101.16 | 93.19 |
| 96.91 | Fib Ext | 99.65 | 96.59 | ||
| 96.54 | LVN | 100.12 | 96.12 | ||
| 96.52 | Open Gap | *BOLD indicates primary objectives | |||
| 95.33 | cVPOC | ||||
| 95.32 | nVPOC | ||||
| 93.44 | LVN | ||||
Gold
In yesterday’s Gold report I wrote, “The 1247 to 1250 zone will be very important to begin the week. A valid push through this zone could spark more buying participation back toward 1270.”
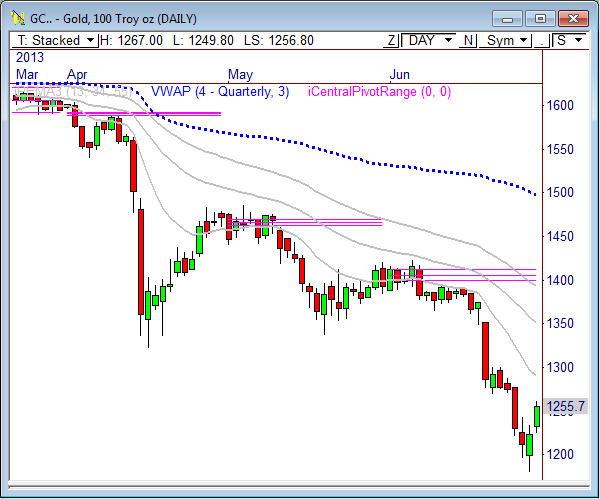
Gold opened the session with early strength Monday and broke through the 1247-50 band of resistance and reached a high of 1261.70 before settling at 1255.40. Prices have continued to show strength in overnight and pre-market trading and reached a high of 1267 this morning, coming within 3 points of the target mentioned in yesterday’s report.
After Gold broke above 1250, it returned to this level for a test after yesterday’s session, finding buyers immediately and thereby converting this level to support. As long as price remains above 1250, continued short term strength will be seen ahead, likely for a test of 1270 above, in addition to 1272.70, 1275.20, and 1275.80, as noted in the Key Levels ladder below.
If these levels are rejected on first advance, we could see another round of selling in this commodity ahead. For now, we’ll have to see how Gold responds between 1250 and 1270, as this is an important battle zone between bulls and bears in the near term.
Here are the targets for the current session and the week ahead:
| PivotBoss Levels & Targets: Gold (GC) | |||||
| Jul 2, 2013 | |||||
| KEY LEVELS | ADR TARGETS | ||||
| 1,372.60 | nVPOC | ADR (5) | ONH | ONL | |
| 1,293.10 | cVPOC | 43.2 | 1,267.00 | 1,249.80 | |
| 1,292.30 | nVPOC | AWR (10) | WH | WL | |
| 1,292.20 | Open Gap | 93.00 | 1,261.70 | 1,244.10 | |
| 1,275.80 | Monthly Pivot | ||||
| 1,275.50 | nVPOC | DAILY TARGETS | WEEKLY TARGETS | ||
| 1,275.20 | Open Gap | BULL | BEAR | BULL | BEAR |
| 1,272.70 | Fib Ext | 1,271.40 | 1,245.40 | 1,313.85 | 1,191.95 |
| 1,267.20 | LVN | 1,282.20 | 1,234.60 | 1,337.10 | 1,168.70 |
| 1,261.70 | PD High | 1,293.00 | 1,223.80 | ||
| 1,256.20 | VPOC | 1,303.80 | 1,213.00 | ||
| 1,255.40 | SETTLE | *BOLD indicates primary objectives | |||
| 1,249.90 | Pivot | ||||
| 1,246.90 | Yearly S3 | ||||
| 1,232.70 | PD Low | ||||
| 1,222.40 | Open Gap | ||||
| 1,222.30 | LVN | ||||
| 1,221.60 | Fib Ext | ||||
| 1,202.30 | nVPOC | ||||
Good luck and trade well.
Frank Ochoa
@PivotBoss


Pingback: All Eyes on 1650 | PivotBoss