E-Mini S&P 500
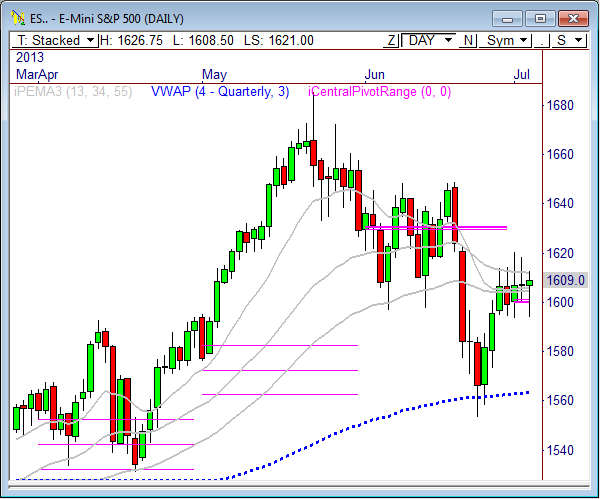
In Wednesday’s ES report I wrote, “The ES continues to trade within the 1595 to 1620.50 range. More trading range activity is likely to occur within this zone heading into Friday’s market.”
The ES opened Wednesday’s session with a gap down and briefly tested 1597s before rallying to fill the gap. The ES topped out 1613 and closed the session at 1610 heading into the 4th of July holiday. Coming out of the holiday, we now see that prices are trading over the 1620 level and are fast approaching a key upper trend line that the market will be watching very closely.
This line connects the highs that have formed since May, and currently crosses price somewhere between 1625 and 1630. The current pre-market high is 1626.75, so the market is clearly watching this line.
This morning is also about the Non-Farm Employment number, which comes out at 7:30am CT. Once this number comes out, we’ll know a lot more about how the market is likely to move.
If the upper trend line remains intact, we could see quite a sell-off back toward a retest of support at 1595 over the next day or two, which will be an important zone to watch. Beyond 1630 is the major 1650 level, which rejected every advanced throughout the month of June. Clearly, a decision point in the charts is upon us. Let’s see which way the market moves.
Watch these key economic reports for today’s price action:
7:30am CT: Non-Farm Employment Change
7:30am CT: Unemployment Rate
Here are the Key Levels and Targets for the current session and the week ahead:
| PivotBoss Levels & Targets: E-Mini S&P 500 (ES) | |||||
| Jul 5, 2013 | |||||
| KEY LEVELS | ADR TARGETS | ||||
| 1,643.50 | nVPOC | ADR (10) | ONH | ONL | |
| 1,616.00 | LVN | 26.75 | 1,626.75 | 1,608.50 | |
| 1,615.75 | nVPOC | AWR (10) | WH | WL | |
| 1,613.00 | PD High | 68.25 | 1,620.50 | 1,593.25 | |
| 1,610.00 | SETTLE | ||||
| 1,608.00 | cVPOC | DAILY TARGETS | WEEKLY TARGETS | ||
| 1,602.00 | VPOC | BULL | BEAR | BULL | BEAR |
| 1,601.00 | LVN | 1,641.94 | 1,613.38 | 1,661.50 | 1,569.31 |
| 1,598.00 | Open Gap | 1,635.25 | 1,606.69 | 1,644.44 | 1,552.25 |
| 1,597.25 | PD Low/HVN | 1,628.56 | 1,600.00 | ||
| 1,588.25 | LVN | 1,621.88 | 1,593.31 | ||
| 1,581.50 | nVPOC | *BOLD indicates primary objectives | |||
| 1,570.25 | LVN | ||||
| 1,559.50 | nVPOC | ||||
E-Mini NASDAQ 100
In Wednesday’s NQ report I wrote, “Not that a whole lot is expected for today’s holiday-shortened trading session, but if 2910 gives way, look for another test at the overnight low of 2897 to 2900 level”
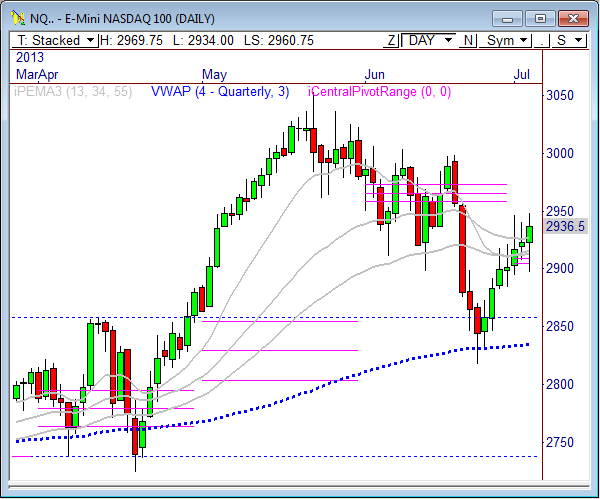
The E-Mini NASDAQ 100 opened Wednesday’s session with a test of the 2910 level in the first minutes of the day, which became the exact low of the session. Price then rallied off this level before topping out at 2949 and closing back at the 2936.50 level.
The daily chart shows the NQ continues to be quite bullish after bouncing off quarterly VWAP in June. Additionally, the NQ has rallied through, and held above, the monthly pivot range, which is rather strong considering the lower value relationship that formed month over month.
There is a major trend line that the market will be watching, which connects the highs that have occurred since May. This line hits somewhere between 2965 and 2970, and will be an important zone to watch today. As a matter of fact, the current pre-market high is 2969.75, and price is already down 10 points from this zone, so it’s clear the market is watching this line, as well.
If price cannot rise beyond this line, and fails to get another retest at 3000, we could see another round of selling ahead. Again, the 2900 to 2910 zone is the key zone of support that needs to be watched for a medium term decline.
Here are the targets for the current session and the week ahead:
| PivotBoss Levels & Targets: E-Mini NASDAQ 100 (NQ) | |||||
| Jul 5, 2013 | |||||
| KEY LEVELS | ADR TARGETS | ||||
| 2,991.00 | cVPOC | ADR (10) | ONH | ONL | |
| 2,986.25 | nVPOC | 49 | 2,969.75 | 2,934.00 | |
| 2,956.25 | Open Gap | AWR (10) | WH | WL | |
| 2,949.00 | PD High | 127.50 | 2,949.00 | 2,894.25 | |
| 2,947.00 | LVN | ||||
| 2,936.50 | SETTLE | DAILY TARGETS | WEEKLY TARGETS | ||
| 2,930.75 | VPOC | BULL | BEAR | BULL | BEAR |
| 2,925.50 | LVN | 2,995.25 | 2,945.25 | 3,021.75 | 2,853.38 |
| 2,910.00 | PD Low | 2,983.00 | 2,933.00 | 2,989.88 | 2,821.50 |
| 2,907.00 | nVPOC | 2,970.75 | 2,920.75 | ||
| 2,902.00 | Open Gap | 2,958.50 | 2,908.50 | ||
| 2,898.25 | LVN | *BOLD indicates primary objectives | |||
| 2,885.00 | HVN | ||||
| 2,876.75 | LVN | ||||
| 2,859.50 | Open Gap | ||||
| 2,855.50 | nVPOC | ||||
| 2,832.25 | nVPOC | ||||
Crude Oil
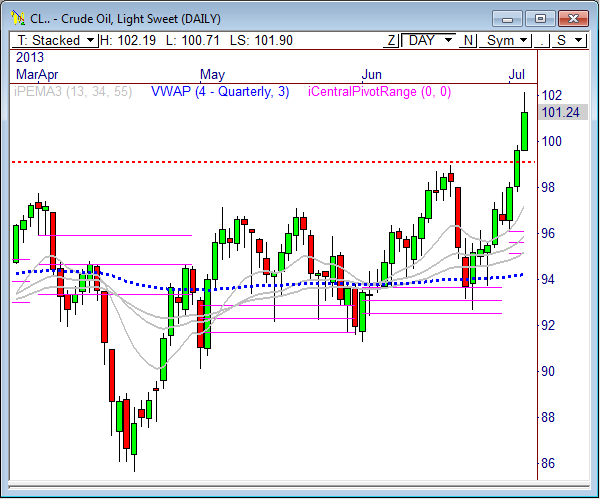
In Wednesday’s Crude report I wrote, “I mentioned yesterday that a break through the 100 level opens the door to 105, and even 110…Our extended weekly bull target is 102.43, so watch this today for a potential test.”
Crude Oil saw an incredible rally ahead of Wednesday’s market and eventually found price levels beyond the 102 level, eventually topping out at 102.18. Prices have bounced around between 100.50 and 102.18, which continues to be the case heading into today’s session.
The fact that prices have held firmly after breaking above the 100 level is quite bullish. The support zone that is building out at 100.50 will become a very important reference point for Crude in the near term. If CL continues to hold above this zone, we could see a push toward the major upper trend line that connects the lower highs in the higher timeframes since 2011, which is roughly 103.80.
At some point, it makes sense that Crude will see a pullback of some kind. A drop into the 99 to 100 zone could offer another opportunity to buy the dip ahead of the next wave of strength ahead. A failure would occur below 99.
Here are the targets for the current session and the week ahead:
| PivotBoss Levels & Targets: Crude Oil (CL) | |||||
| Jul 5, 2013 | |||||
| KEY LEVELS | ADR TARGETS | ||||
| 103.36 | Monthly R2 | ADR (10) | ONH | ONL | |
| 102.16 | PD High | 2.28 | 102.19 | 100.71 | |
| 101.44 | nVPOC | AWR (10) | WH | WL | |
| 101.23 | SETTLE | 5.09 | 102.18 | 96.07 | |
| 100.52 | PD Low | ||||
| 99.96 | Monthly R1 | DAILY TARGETS | WEEKLY TARGETS | ||
| 99.42 | Open Gap | BULL | BEAR | BULL | BEAR |
| 99.00 | LVN | 103.56 | 101.05 | 101.16 | 98.36 |
| 98.94 | nVPOC | 102.99 | 100.48 | 99.89 | 97.09 |
| 98.04 | Open Gap | 102.42 | 99.91 | ||
| 97.92 | nVPOC | 101.85 | 99.34 | ||
| 97.15 | nVPOC | *BOLD indicates primary objectives | |||
| 96.54 | LVN | ||||
| 96.52 | Open Gap | ||||
| 94.91 | cVPOC | ||||
| 93.45 | nVPOC | ||||
Gold
In Wednesday’s Gold report I wrote, “There is a ton of overhead resistance, namely 1267.10, 1270, 1275.20, but if price can push through this zone then 1300 to 1301.3 could be the next target zone to watch, and potentially sell for another wave of weakness.”
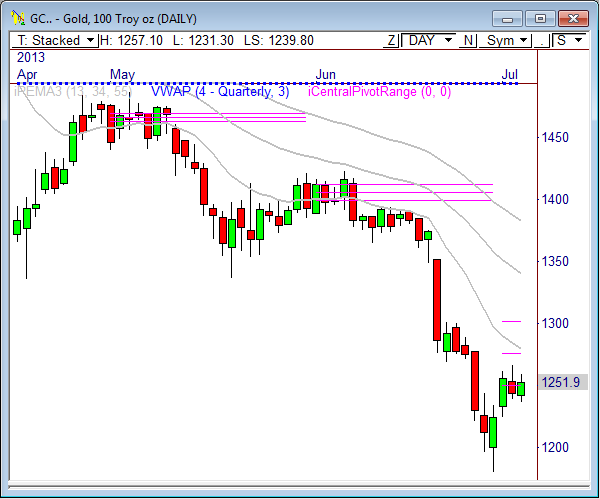
The 1267 level became a formidable area of resistance, as Gold was not able to rise for another retest of this zone during Wednesday’s market. Instead, prices traded within the 1235 to 1260 range ahead of its next move.
As a matter of fact, Gold is trading within a rather tight 3-day range that spans from 1224 to 1267. A breakout from this range could spark the next near term move, so watch the boundaries closely. An upside break through 1267 opens the door to 1300, while a downside push through 1224 could lead to a retest of prior lows at around 1180.
Further development within this range could be seen before the next major break, so be patient and watch the levels closely.
Short term, keep an eye on 1231.30, which is the current overnight low. A violation of this level opens the door to 1210. If it holds, then we likely see another test at 1250.
Here are the targets for the current session and the week ahead:
| PivotBoss Levels & Targets: Gold (GC) | |||||
| Jul 5, 2013 | |||||
| KEY LEVELS | ADR TARGETS | ||||
| 1,292.80 | cVPOC | ADR (10) | ONH | ONL | |
| 1,292.70 | nVPOC | 40.2 | 1,257.10 | 1,231.30 | |
| 1,292.20 | Open Gap | AWR (10) | WH | WL | |
| 1,275.80 | Monthly Pivot | 93.00 | 1,267.00 | 1,224.10 | |
| 1,275.30 | nVPOC | ||||
| 1,275.20 | Open Gap | DAILY TARGETS | WEEKLY TARGETS | ||
| 1,267.10 | LVN | BULL | BEAR | BULL | BEAR |
| 1,255.30 | PD High | 1,281.55 | 1,237.00 | 1,317.10 | 1,197.25 |
| 1,252.30 | SETTLE | 1,271.50 | 1,226.95 | 1,293.85 | 1,174.00 |
| 1,248.80 | HVA | 1,261.45 | 1,216.90 | ||
| 1,248.00 | VPOC | 1,251.40 | 1,206.85 | ||
| 1,246.90 | Yearly S3 | *BOLD indicates primary objectives | |||
| 1,244.20 | PD Low | ||||
| 1,230.60 | nVPOC | ||||
| 1,222.40 | Open Gap | ||||
| 1,222.30 | LVN | ||||
| 1,192.10 | nVPOC | ||||
Good luck and trade well.
Frank Ochoa
@PivotBoss


Pingback: The March Toward 1650 | PivotBoss