E-Mini S&P 500
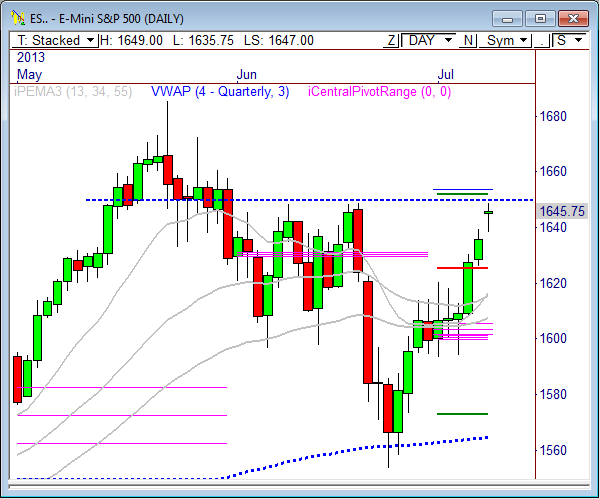
In yesterday’s ES report I wrote, “Beyond 1642 forecasts another major test at the 1648.50 to 1650 zone of resistance, which has rejected every advance since June.”
Well, once again overnight trading ruled the day, as the ES took out Monday’s high late in the evening and rallied to 1646.50, all before Tuesday’s opening bell. After taking a gap up at the RTH open, the ES auctioned lower and found buyers at 1639 and rallied slowly the rest of the session, topping out at our target of 1648.50 to 1650.
The 1650 level continues to be the zone to watch for the S&P 500. Given the recent rally from the 1553.25 level, the market may be short term overextended and due for a pullback. The 1650 level gives the S&P a nice zone to retreat from, and should a retracement occur I’ll be watching 1621.50 and 1613 for targets.
However, there is a feeling among floor traders, including MrTopStep’s Danny Riley that stops are being targeted above 1649, likely at the 1654 level. The market could take out these last buy stops and then drop into retracement mode after that. Our primary bull objective for the day is 1654.25, so watch this level very closely.
Here’s the day’s economic calendar:
1:00pm CT FOMC Meeting Minutes
3:10pm CT Fed Chairman Bernanke Speaks
Here are the Key Levels and Targets for the current session and the week ahead:
| PivotBoss Levels & Targets: E-Mini S&P 500 (ES) | |||||
| Jul 10, 2013 | |||||
| KEY LEVELS | ADR TARGETS | ||||
| 1,660.00 | LVN | ADR (5) | ONH | ONL | |
| 1,656.25 | HVN | 17.25 | 1,648.25 | 1,641.25 | |
| 1,649.00 | PD High | AWR (10) | WH | WL | |
| 1,648.75 | LVN | 63.50 | 1,645.00 | 1,626.00 | |
| 1,646.75 | VPOC | ||||
| 1,645.50 | SETTLE | DAILY TARGETS | WEEKLY TARGETS | ||
| 1,643.50 | nVPOC | BULL | BEAR | BULL | BEAR |
| 1,640.00 | LVN | 1,662.81 | 1,639.63 | 1,689.50 | 1,597.38 |
| 1,638.25 | PD Low | 1,658.50 | 1,635.31 | 1,673.63 | 1,581.50 |
| 1,635.75 | Open Gap | 1,654.19 | 1,631.00 | ||
| 1,628.25 | Open Gap | 1,649.88 | 1,626.69 | ||
| 1,626.25 | cVPOC | *BOLD indicates primary objectives | |||
| 1,621.25 | LVN | ||||
| 1,618.75 | nVPOC | ||||
| 1,616.00 | LVN | ||||
| 1,615.75 | nVPOC | ||||
| 1,602.00 | nVPOC | ||||
| 1,601.00 | LVN | ||||
| 1,598.00 | Open Gap | ||||
E-Mini NASDAQ 100
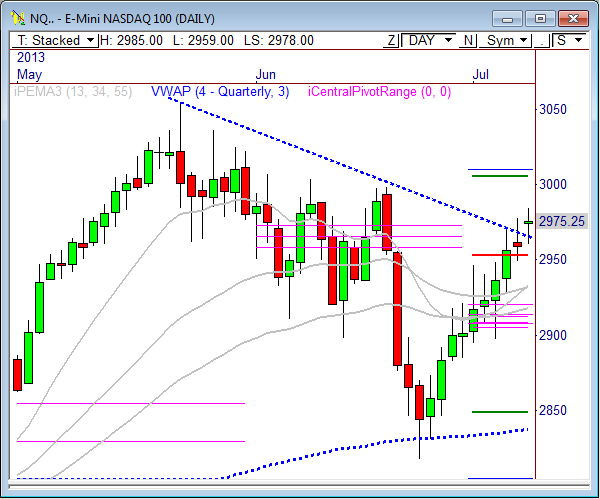
In yesterday’s NQ report I wrote, “The 2950 level should remain intact today, which means we could see new highs within the current uptrend. Watch 2978 for signs of continued strength toward 2990.”
The E-Mini NASDAQ 100 opened the day with a gap up this morning, but auctioned lower to fill the gap and find buyers. Price then bounced off the pivot range near 2960 and rallied through 2978 to reach highs of 2985 before the final bell. While the NQ stopped just shy of our primary bull target of 2990, there could be more upside ahead, as the market may “need” to test the 3000 zone before its next key move.
The NQ continues to hold between 2970 and 2985 in overnight and pre-market trading. A breakout from this range will likely spark the early move in this contract. Continued overall strength is likely to occur above 2960, so we could see buyers step in between 2960 and 2965. However, a violation of 2960 opens the door to 2956.25, 2953.50, and 2950.
Beyond 2985 sees a likely test at composite VPOC at 2991.25, with a shot at the day’s primary bull objective of 2996.75.
Here are the targets for the current session and the week ahead:
| PivotBoss Levels & Targets: E-Mini NASDAQ 100 (NQ) | |||||
| Jul 10, 2013 | |||||
| KEY LEVELS | ADR TARGETS | ||||
| 3,004.50 | LVN | ADR (5) | ONH | ONL | |
| 2,991.25 | cVPOC | 37 | 2,981.25 | 2,969.00 | |
| 2,986.25 | nVPOC | AWR (10) | WH | WL | |
| 2,985.00 | PD High | 123.00 | 2,977.50 | 2,948.75 | |
| 2,984.50 | LVN | ||||
| 2,977.00 | VPOC | DAILY TARGETS | WEEKLY TARGETS | ||
| 2,975.25 | SETTLE | BULL | BEAR | BULL | BEAR |
| 2,973.50 | LVN | 3,015.25 | 2,962.75 | 3,071.75 | 2,885.25 |
| 2,963.00 | LVN | 3,006.00 | 2,953.50 | 3,041.00 | 2,854.50 |
| 2,960.25 | PD Low | 2,996.75 | 2,944.25 | ||
| 2,957.00 | nVPOC | 2,987.50 | 2,935.00 | ||
| 2,956.25 | Open Gap | *BOLD indicates primary objectives | |||
| 2,950.00 | LVN | ||||
| 2,938.00 | HVN | ||||
| 2,925.50 | LVN | ||||
| 2,907.00 | nVPOC | ||||
| 2,902.00 | Open Gap | ||||
| 2,898.25 | LVN | ||||
Crude Oil
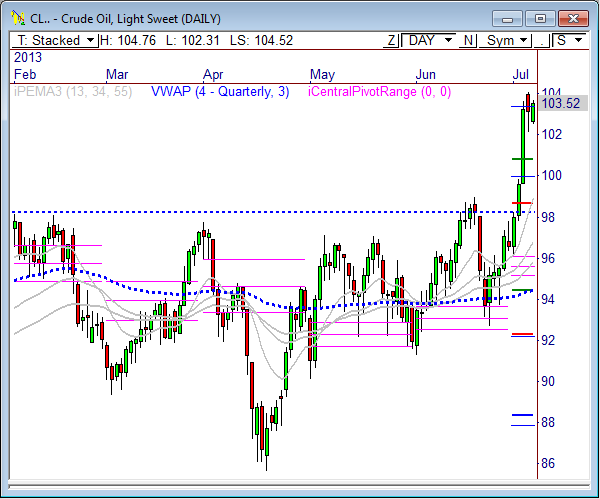
In yesterday’s Crude report I wrote, “Crude is beginning to hold and digest recent gains, forming a tight range from 102 to 104.15. Look for Crude to continue to build out within this range until a decisive breakout occurs. Such a breakout could lead to the next big move, likely to the upside.”
Crude Oil opened the day with early weakness this morning, as prices dropped into the 102 support zone mentioned in above. Buyers responded with heavy buys off this zone, which eventually led to a huge breakout and an after hours rally that saw price reach highs of 104.79 by 5pm CT. Clearly, CL is extremely bullish right now, and as long as 102 continues to hold as near term support, we’re likely to see more strength ahead toward the R1 Yearly pivot point at 110.
Crude Oil has officially hit 105, which I wrote as my first upside target objective on July 2. As long as 102 continues to hold, further strength is likely to occur toward my weekly target of 106.41, seen below. Every pullback should be a buying opportunity in Crude. As a matter of fact, look to buy a dip into the 103.80 to 104.08 zone, as a retest in this range could spark some major buying participation.
Here are the targets for the current session and the week ahead:
| PivotBoss Levels & Targets: Crude Oil (CL) | |||||
| Jul 10, 2013 | |||||
| KEY LEVELS | ADR TARGETS | ||||
| 110.00 | Yearly R1 | ADR (5) | ONH | ONL | |
| 104.75 | Monthly H5 | 2.56 | 105.33 | 104.21 | |
| 103.73 | PD High | AWR (10) | WH | WL | |
| 103.52 | SETTLE | 5.70 | 105.33 | 102.13 | |
| 103.36 | Monthly R2 | ||||
| 103.34 | LVN | DAILY TARGETS | WEEKLY TARGETS | ||
| 103.27 | VPOC | BULL | BEAR | BULL | BEAR |
| 102.51 | PD Low | 107.41 | 104.05 | 107.83 | 101.06 |
| 102.26 | LVN | 106.77 | 103.41 | 106.41 | 99.63 |
| 102.20 | LVN | 106.13 | 102.77 | ||
| 101.56 | HVN | 105.49 | 102.13 | ||
| 101.44 | nVPOC | *BOLD indicates primary objectives | |||
| 101.13 | LVN | ||||
| 100.97 | Open Gap | ||||
| 100.52 | LVN | ||||
| 99.96 | Monthly R1 | ||||
| 99.42 | Open Gap | ||||
| 99.00 | LVN | ||||
| 98.94 | nVPOC | ||||
Gold
In yesterday’s Gold report I wrote, “The major level to watch for medium term strength is 1260, as a push through this zone paves the way to a test at 1300. If Gold cannot hold above 1240, we could see a return trip to value at 1233 and the 1222 LVN.”
Gold traded rather quietly during Tuesday’s market, which makes sense given the move that occurred during the overnight session. Price basically remained within the 1240 to 1260 range during RTH trading, which is the range I wrote about in yesterday’s report. As a it turns out, this range remains the one to watch heading into Wednesday’s open.
The 60-minute chart shows Gold has built out a large triangle pattern, which could be the pattern that sparks the next major breakout move. The backend of this pattern measure about 87 points, which means a breakout could push price about 65 to 87 points in the direction of the break. Continue to watch the 1260 level, as this zone could be the upside release point for the triangle.
If 1260 to 1267 continues to hold as resistance, look for a drop toward the bottom of the pattern between 1230 and 1235. A violation through 1230 could open the door to another wave of weakness below 1200.
Keep an eye on the monthly pivot range in the daily timeframe. With Gold in a long term downtrend, every pullback to the pivot range becomes a swing selling opportunity, and GC continues to hold in this zone as we speak. I’d say a push into the 1275.60 to 1301.30 zone could be a major sell opportunity, unless the bulls can convert 1300, which is no easy task at this juncture.
Here are the targets for the current session and the week ahead:
| PivotBoss Levels & Targets: Gold (GC) | |||||
| Jul 10, 2013 | |||||
| KEY LEVELS | ADR TARGETS | ||||
| 1,293.00 | nVPOC | ADR (5) | ONH | ONL | |
| 1,292.70 | nVPOC | 33.6 | 1,256.80 | 1,242.20 | |
| 1,292.20 | Open Gap | AWR (10) | WH | WL | |
| 1,275.80 | Monthly Pivot | 111.60 | 1,258.70 | 1,214.40 | |
| 1,275.30 | nVPOC | ||||
| 1,275.20 | Open Gap | DAILY TARGETS | WEEKLY TARGETS | ||
| 1,267.00 | LVN | BULL | BEAR | BULL | BEAR |
| 1,260.00 | LVN | 1,284.20 | 1,240.00 | 1,326.00 | 1,175.00 |
| 1,256.00 | PD High | 1,275.80 | 1,231.60 | 1,298.10 | 1,147.10 |
| 1,249.30 | nVPOC | 1,267.40 | 1,223.20 | ||
| 1,248.90 | Open Gap | 1,259.00 | 1,214.80 | ||
| 1,248.80 | HVA | *BOLD indicates primary objectives | |||
| 1,248.00 | VPOC | ||||
| 1,246.90 | Yearly S3 | ||||
| 1,246.30 | SETTLE | ||||
| 1,243.90 | PD Low | ||||
| 1,235.00 | Open Gap | ||||
| 1,234.20 | cVPOC/nVPOC | ||||
| 1,230.60 | nVPOC | ||||
| 1,222.60 | LVN | ||||
| 1,222.40 | Open Gap | ||||
| 1,213.20 | nVPOC | ||||
| 1,212.30 | Open Gap | ||||
Good luck and trade well.
Frank Ochoa
@PivotBoss


Pingback: Big Time Fed Rally | PivotBoss