E-Mini S&P 500
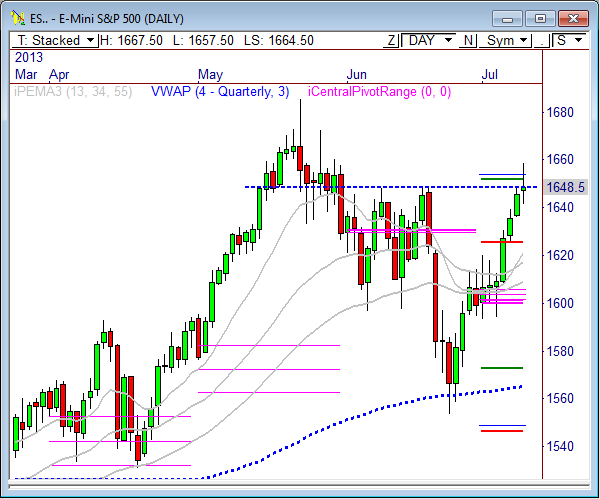
In yesterday’s ES report I wrote, “there is a feeling among floor traders, including MrTopStep’s Danny Riley that stops are being targeted above 1649, likely at the 1654 level. The market could take out these last buy stops and then drop into retracement mode after that. Our primary bull objective for the day is 1654.25, so watch this level very closely.”
The current rally in the S&P has been nothing short of phenomenal. As a matter of fact, Wednesday’s trading all the way around was wild when you include all the various futures and commodities that were moving big points all day, from overnight to after hours trading, including the Euro, Gold, Crude Oil, and the major market indexes.
The E-Mini S&P opened Wednesday’s session with a fairly tight range beneath the 1650 level and eventually got a push toward the 1653 level upon the release of the FOMC Meeting Minutes. Later in the day, Fed Chairman Ben Bernanke gave a speech, and then took questions, which essentially became a huge catalyst for markets across the board, as prices exploded higher in most commodities I follow. If you were wondering what information the vast majority of the market is following, now you know. It’s all about the Fed.
The ES rallied just after the RTH close and pushed right to our primary bull target of 1654.25 on the day, and then really caught some steam up to 1667.50, which is currently the pre-market high. The S&P is already retesting levels not seen since the May highs, further showing how incredibly strong the bounce off the 1553.25 level has been, and many are now calling for a huge finish to the year.
There are some key levels to watch above for today’s trading, including the LVN at 1671 and the naked VPOC at 1677.50. Also, the week’s primary bull target is 1673.50, so there are plenty of levels to target above.
If price breaks below the 1662 level, we could see a short term pullback toward the day’s primary bear objective at 1654.75.
Here’s the day’s economic calendar:
7:30am CT Unemployment Claims
7:30am CT Import Prices m/m
9:30am CT Natural Gas Storage
10:00am CT FOMC Member Tarullo Speaks
12:00pm CT 30-y Bond Auction
1:00pm CT Federal Budget Balance
Here are the Key Levels and Targets for the current session and the week ahead:
| PivotBoss Levels & Targets: E-Mini S&P 500 (ES) | |||||
| Jul 11, 2013 | |||||
| KEY LEVELS | ADR TARGETS | ||||
| 1,677.50 | nVPOC | ADR (5) | ONH | ONL | |
| 1,671.00 | LVN | 17 | 1,667.50 | 1,657.50 | |
| 1,660.00 | LVN | AWR (10) | WH | WL | |
| 1,657.50 | Fib Ext | 63.50 | 1,667.50 | 1,626.00 | |
| 1,656.25 | HVN | ||||
| 1,653.00 | PD High | DAILY TARGETS | WEEKLY TARGETS | ||
| 1,648.75 | SETTLE | BULL | BEAR | BULL | BEAR |
| 1,644.75 | cVPOC | 1,678.75 | 1,659.00 | 1,689.50 | 1,619.88 |
| 1,644.50 | VPOC | 1,674.50 | 1,654.75 | 1,673.63 | 1,604.00 |
| 1,641.50 | PD Low | 1,670.25 | 1,650.50 | ||
| 1,641.25 | LVN | 1,666.00 | 1,646.25 | ||
| 1,637.25 | Fib Ext/HVN | *BOLD indicates primary objectives | |||
| 1,635.75 | Open Gap | ||||
| 1,635.00 | nVPOC | ||||
| 1,628.25 | Open Gap | ||||
| 1,626.50 | HVN | ||||
| 1,622.00 | LVN | ||||
| 1,618.75 | nVPOC | ||||
| 1,616.00 | LVN | ||||
| 1,615.75 | nVPOC | ||||
E-Mini NASDAQ 100
In yesterday’s NQ report I wrote, “The NQ continues to hold between 2970 and 2985 in overnight and pre-market trading. A breakout from this range will likely spark the early move in this contract…Beyond 2985 sees a likely test at composite VPOC at 2991.25, with a shot at the day’s primary bull objective of 2996.75.”
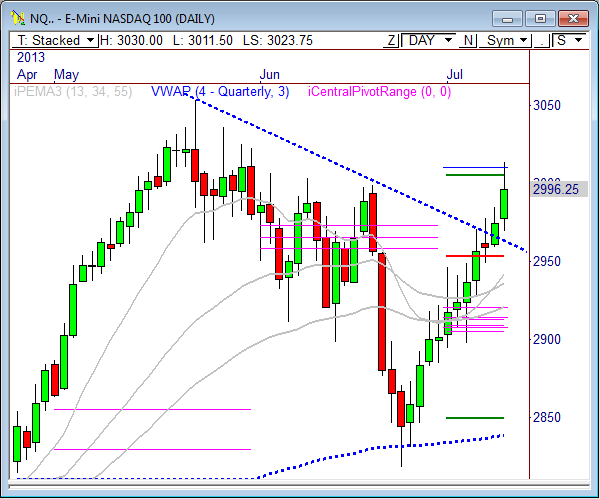
The NQ opened Wednesday’s trading with early strength right out of the gate, but cautiously held below the 2989 level before getting the upside break upon the Fed Minutes release. The late-day break sparked an immediate push to 3000, filling both of our primary objectives of 2991.25 and 2996.75. However, this was only the beginning of the move, as the NQ got a major spark 45 minutes after the RTH close that sent prices soaring to 3030 by early this morning.
Another day, another huge move in after hours trading. The NQ is now just 23.50 points from the May high of 3053.50.
For today’s market, watch the 3020 level as near-term support. If price continues to hold above this zone, look for price to approach the day’s primary bull target of 3041, which also happens to be the primary target for the week. If price breaks below 3020, look for profit objectives at 3010 and 3000.50.
Here are the targets for the current session and the week ahead:
| PivotBoss Levels & Targets: E-Mini NASDAQ 100 (NQ) | |||||
| Jul 11, 2013 | |||||
| KEY LEVELS | ADR TARGETS | ||||
| 3,026.25 | nVPOC/LVN | ADR (5) | ONH | ONL | |
| 3,010.00 | Fix Ext/HVN | 39.25 | 3,030.00 | 3,011.50 | |
| 3,008.00 | nVPOC | AWR (10) | WH | WL | |
| 3,004.50 | LVN | 123.00 | 3,030.00 | 2,948.75 | |
| 3,000.00 | PD High | ||||
| 2,997.00 | SETTLE | DAILY TARGETS | WEEKLY TARGETS | ||
| 2,991.00 | cVPOC | BULL | BEAR | BULL | BEAR |
| 2,986.25 | nVPOC | 3,060.56 | 3,010.38 | 3,071.75 | 2,937.75 |
| 2,984.50 | VPOC | 3,050.75 | 3,000.56 | 3,041.00 | 2,907.00 |
| 2,973.50 | LVN | 3,040.94 | 2,990.75 | ||
| 2,973.25 | PD Low | 3,031.13 | 2,980.94 | ||
| 2,963.25 | Fib Ext | *BOLD indicates primary objectives | |||
| 2,963.00 | LVN | ||||
| 2,957.00 | nVPOC | ||||
| 2,956.25 | Open Gap | ||||
| 2,950.00 | LVN | ||||
Crude Oil
In yesterday’s Crude report I wrote, “Crude Oil has officially hit 105, which I wrote as my first upside target objective on July 2. As long as 102 continues to hold, further strength is likely to occur toward my weekly target of 106.41.”
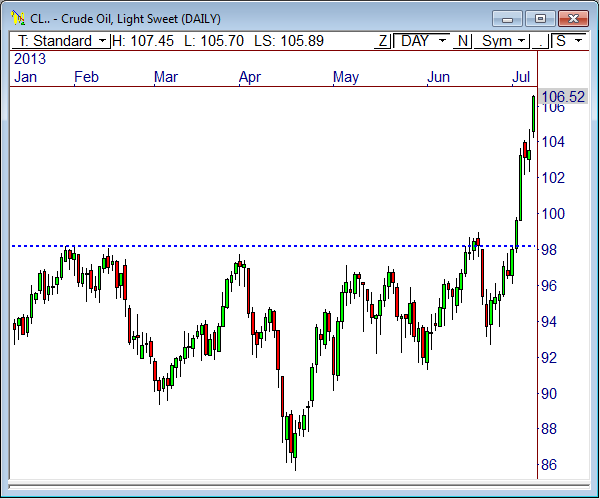
Another day, another huge rally in Crude Oil! What an amazing run this commodity has had lately, and it all occurred upon the break through the 99 to 100 zone of resistance we called out last week! As a matter of fact, Crude hit our primary weekly target of 106.41 in Wednesday’s trading, and has come within .38 of hitting our full range ADR weekly target of 107.83 in pre-market trading today.
While Crude has had an amazing liftoff, I’m currently seeing signs of short term exhaustion, as prices have dropped nearly 2 points from the 1am highs heading into the RTH session. As of right now, we’ll be opening about .70 off Wednesday’s RTH close of 106.49, which could spark a retest of the 105 level.
Also, CL has already traded a range of 2 points today, and the current 5-day average day range is 2.61, so there may not be much more left in the tank for today’s trading. Given the extreme range of price movement we’ve seen, it’s not out of the question that Crude could trade in a digestive mode today.
Continued overall strength is likely in Crude, especially if 102.20 continues to hold, and there are two LVNs that will offer support upon a retest – one at 105.05, and the other at 104.20, so watch these closely.
Also, given the current sell-off from the morning highs, an rally into the 106.20 to 106.40 zone could be a short term sell within the current decline, at least given the current structure of the market heading into the RTH open.
Here are the targets for the current session and the week ahead:
| PivotBoss Levels & Targets: Crude Oil (CL) | |||||
| Jul 11, 2013 | |||||
| KEY LEVELS | ADR TARGETS | ||||
| 110.00 | Yearly R1 | ADR (5) | ONH | ONL | |
| 107.33 | Fix Ext | 2.61 | 107.45 | 105.42 | |
| 106.66 | PD High | AWR (10) | WH | WL | |
| 106.49 | SETTLE | 5.70 | 107.45 | 102.13 | |
| 105.05 | LVN | ||||
| 104.91 | PD Low | DAILY TARGETS | WEEKLY TARGETS | ||
| 104.24 | Fix Ext | BULL | BEAR | BULL | BEAR |
| 104.20 | LVN | 108.68 | 106.15 | 107.83 | 103.18 |
| 103.52 | Open Gap | 108.03 | 105.49 | 106.41 | 101.75 |
| 103.36 | Monthly R2 | 107.38 | 104.84 | ||
| 103.34 | LVN | 106.73 | 104.19 | ||
| 103.27 | VPOC | *BOLD indicates primary objectives | |||
| 103.02 | HVN | ||||
| 102.26 | LVN | ||||
| 102.20 | LVN | ||||
| 101.56 | HVN | ||||
Gold
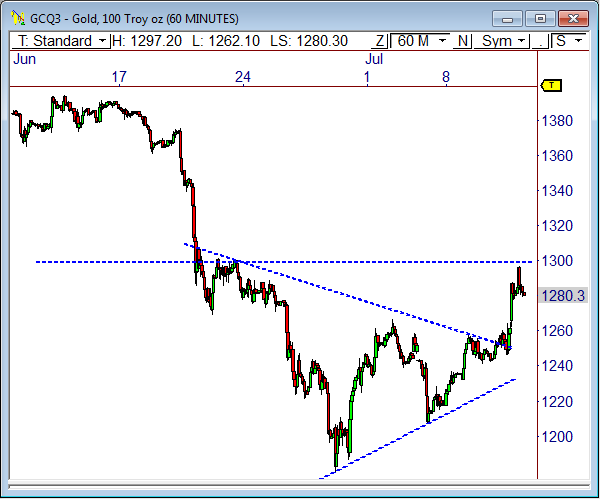
In yesterday’s Gold report I wrote, “The 60-minute chart shows Gold has built out a large triangle pattern, which could be the pattern that sparks the next major breakout move. The backend of this pattern measure about 87 points, which means a breakout could push price about 65 to 87 points in the direction of the break. Continue to watch the 1260 level, as this zone could be the upside release point for the triangle.”
Gold got the big breakout from the triangle pattern that I wrote about in yesterday’s report, getting a push through the 1260 resistance zone and eventually rallying to a high of 1297.20 in overnight trading, stopping just shy of our primary weekly bull target of 1298.10 (seen in the table below). I thought we’d see a solid breakout from this range, but as has been customary lately, the entire move came after hours.
The daily chart shows Gold is now butting up against the top of the monthly pivot range at 1301.50, which coincides with the round number of 1300. If price cannot rise beyond this zone soon, this area could offer the next swing short position in this commodity. You see, the lower value relationship on a month to month basis using the pivot range usually offers great sell the rip opportunities during a bear trending market, so watch this closely ahead.
Also, GC is holding within the sell trigger zone of the stacked and sloped downtrending moving averages, further adding to the sell signal.
Short term, the 5-minute chart shows price is forming a head-and-shoulders pattern that has a neck line at 1278. A violation of this level could open the door to weakness down to 1265 for a key retest ahead. Beyond 1301.50 could introduce 1317, which could be an even better zone to watch for swing shorts.
Here are the targets for the current session and the week ahead:
| PivotBoss Levels & Targets: Gold (GC) | |||||
| Jul 11, 2013 | |||||
| KEY LEVELS | ADR TARGETS | ||||
| 1,301.50 | Monthly TC | ADR (5) | ONH | ONL | |
| 1,293.00 | nVPOC | 30.7 | 1,297.20 | 1,262.10 | |
| 1,292.70 | nVPOC | AWR (10) | WH | WL | |
| 1,292.20 | Open Gap | 111.60 | 1,297.20 | 1,214.40 | |
| 1,291.10 | Monthly H3 | ||||
| 1,277.50 | LVN | DAILY TARGETS | WEEKLY TARGETS | ||
| 1,275.80 | Monthly Pivot | BULL | BEAR | BULL | BEAR |
| 1,275.30 | nVPOC | 1,300.48 | 1,281.85 | 1,326.00 | 1,213.50 |
| 1,275.20 | Open Gap | 1,292.80 | 1,274.18 | 1,298.10 | 1,185.60 |
| 1,267.00 | LVN | 1,285.13 | 1,266.50 | ||
| 1,266.20 | Fib Ext | 1,277.45 | 1,258.83 | ||
| 1,265.20 | LVN | *BOLD indicates primary objectives | |||
| 1,260.80 | PD High | ||||
| 1,255.00 | HVN | ||||
| 1,249.30 | nVPOC | ||||
| 1,248.90 | Open Gap | ||||
| 1,248.80 | HVA | ||||
| 1,248.00 | VPOC | ||||
| 1,246.90 | Yearly S3 | ||||
| 1,247.60 | SETTLE | ||||
| 1,246.50 | PD Low | ||||
| 1,241.10 | Fib Ext | ||||
Good luck and trade well.
Frank Ochoa
@PivotBoss


Pingback: Gold is Setting Up Another Sell | PivotBoss