
PB View
The market continues to push higher, but is certainly beginning to lose a little steam, as the average daily ranges of the markets have tumbled in the last two weeks. As a matter of fact, the S&P 500 futures had an ADR value of 32.75 two weeks ago, and is now trading an average of just 12.50 points per day, including extended hours trading.
Summer trading is definitely upon us, but there is still plenty of opportunity out there, especially in other contracts, like Crude Oil, Gold, and the Euro FX. Regardless of what you are trading, it is important to let price come to your levels. Don’t chase the market during summer trading. Identify your levels and trade your plan. Yes we all crave great volatility for trading, but low volatility days can give you a much needed rest, and provide an opportunity for research, study, and refinement of your techniques.
The ES continues to approach the May high of 1685.75. I think the market wants to retest the May highs, but I’m not sure what happens after that. I’d like to say that a congestion or retracement will occur, but this market has taken the elevator up, and the stairs down, and that’s vastly different behavior from the “norm”. Also, keep in mind, FOMC Member George speaks today at 1:15pm CT, so the market will likely be tuned in.
Cheers!
Frank Ochoa
PivotBoss | Own the Market
Follow me on Twitter: @PivotBoss
______________________________________________________
This daily report is currently free and open to the public, as I gather feedback and ideas ahead of a formal subscription offering later in the summer. If you have any feedback regarding anything in the report (good or bad) please provide it below in the comments section. Your comments will definitely help shape the report for the better. Thank you!
E-Mini S&P 500
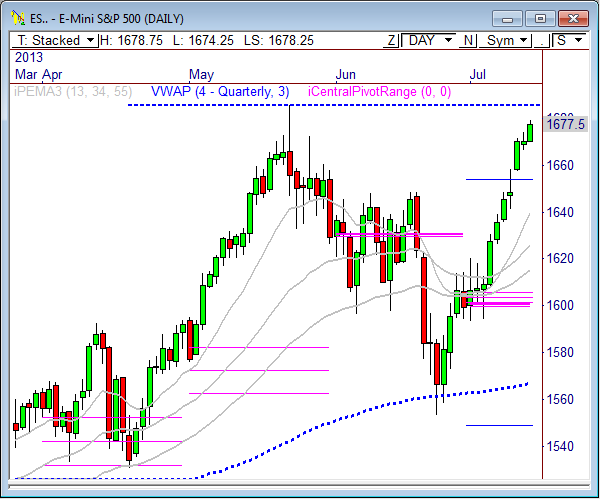
In Friday’s ES report I wrote, “The fact that this gap occurred beyond the major 1650 resistance level only fuels the bulls at this point, as the ES marches toward the high of the year at 1685.75.”
The ES continues to push higher toward the high of the year at 1685.75 and today could be the day we finally get that test. The market has been extremely bullish lately, and it’s very hard to think it will stop on a dime once 85.75 is hit. However, the market has experienced an intense bull run twice in under four months, and could begin to lose steam heading into the tail end of the summer.
The ES is currently trading within a very narrow overnight range of just 4 points, which indicates we could see an early move right out of the gate. Watch the overnight range for early directional cues – 1678.25 up, and 1674.25 down. If price finally gets a taste of the 1680’s, look for price to approach the following upside targets: 1682.25, 1683.50, 1685.75, and 1686.75. If the ES cannot stay hold the 1674.25 level, and especially yesterday’s low of 1672.75, we could see a push toward 1669.50 and 1666.25.
Here’s the day’s economic calendar:
7:30am CT Core CPI m/m
9:00am CT NAHB Housing Market Index
1:15pm CT FOMC Member George Speaks
Here are the Key Levels and Targets for the current session:
| PivotBoss Levels & Targets: E-Mini S&P 500 (ES) | |||||
| Jul 16, 2013 | |||||
| KEY LEVELS | ADR TARGETS | ||||
| 1,685.75 | YTD High | ADR (5) | ONH | ONL | |
| 1,682.25 | Fib Ext | 12.5 | 1,678.75 | 1,674.25 | |
| 1,679.75 | LVN | AWR (10) | WH | WL | |
| 1,679.50 | PD High | 51.25 | 1,679.50 | 1,669.75 | |
| 1,677.50 | SETTLE/VPOC | ||||
| 1,672.75 | PD Low | DAILY TARGETS | WEEKLY TARGETS | ||
| 1,670.50 | Open Gap | BULL | BEAR | BULL | BEAR |
| 1,670.00 | HVN | 1,689.88 | 1,672.50 | 1,721.00 | 1,641.06 |
| 1,669.75 | nVPOC | 1,686.75 | 1,669.38 | 1,708.19 | 1,628.25 |
| 1,669.50 | Fib Ext | 1,683.63 | 1,666.25 | ||
| 1,664.50 | HVN | 1,680.50 | 1,663.13 | ||
| 1,660.50 | LVN | *BOLD indicates primary objectives | |||
| 1,656.00 | HVN | ||||
| 1,652.25 | LVN | ||||
| 1,648.75 | Open Gap | ||||
| 1,644.75 | cVPOC | ||||
| 1,644.50 | nVPOC | ||||
E-Mini NASDAQ 100
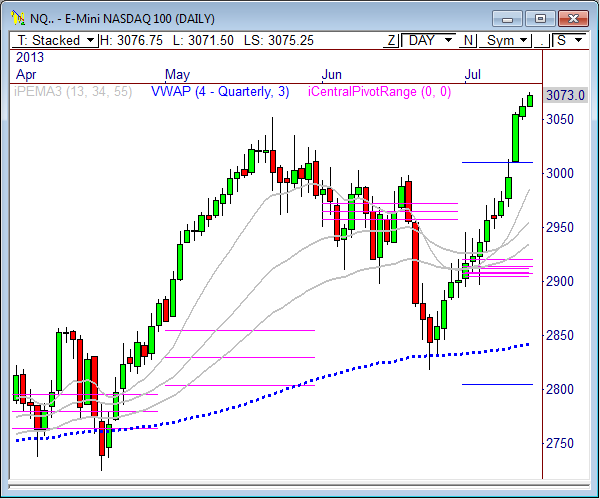
In Friday’s NQ report I wrote, “Given the massive move we’ve seen in the NQ recently, and especially Thursday, it wouldn’t be out of the question to see some range movement Friday. With the massive “Pro” gap serving as support at 3025.25, look for a potential inside day to develop if Thursday’s RTH boundaries hold early in the session.”
The E-Mini NASDAQ 100 traded quietly during Friday’s market, which was matched by Monday’s trading, as well. The NQ is holding at the year’s highs, but has certainly lost some “umph”. As a matter of fact, the current overnight range is only 5.5 points, and could be a precursor to more sideways trading, or an actual early morning move. But by no means do I forecast a huge trading range for today’s session, as the average daily range is currently 30.50 points (down from 55.50 two weeks ago).
As long as price remains above 3071.50, look for short term strength toward 3086.75 and 3094.25. Below 71.50 opens the door to 3061.50 and 3054.
Here are the targets for the current session and the week ahead:
| PivotBoss Levels & Targets: E-Mini NASDAQ 100 (NQ) | |||||
| Jul 16, 2013 | |||||
| KEY LEVELS | ADR TARGETS | ||||
| 3,096.25 | Monthly H5 | ADR (5) | ONH | ONL | |
| 3,081.50 | Fib Ext | 30.5 | 3,076.75 | 3,071.50 | |
| 3,076.50 | PD High | AWR (10) | WH | WL | |
| 3,073.25 | SETTLE | 123.00 | 3,058.00 | 2,948.75 | |
| 3,072.50 | VPOC | ||||
| 3,063.00 | PD Low | DAILY TARGETS | WEEKLY TARGETS | ||
| 3,062.75 | LVN | BULL | BEAR | BULL | BEAR |
| 3,058.00 | Fib Ext | 3,109.63 | 3,061.50 | 3,071.75 | 2,965.75 |
| 3,056.75 | nVPOC | 3,102.00 | 3,053.88 | 3,041.00 | 2,935.00 |
| 3,051.50 | HVN | 3,094.38 | 3,046.25 | ||
| 3,047.00 | LVN | 3,086.75 | 3,038.63 | ||
| 3,033.50 | LVN | *BOLD indicates primary objectives | |||
| 3,029.50 | nVPOC | ||||
| 3,025.50 | LVN | ||||
| 3,010.00 | HVN | ||||
| 3,008.00 | nVPOC | ||||
| 3,006.50 | LVN | ||||
| 2,997.00 | Open Gap | ||||
| 2,995.00 | nVPOC | ||||
| 2,991.00 | cVPOC | ||||
Crude Oil
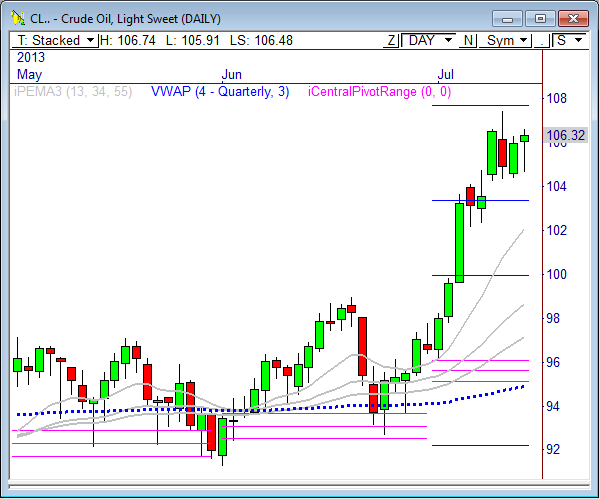
In Friday’s Crude report I wrote, “If the 104.20 level continues to hold as support, we could see a digestion day between 104.20 and 106.00. A failure to rise above 106 could bring out the bears once again, so watch this zone closely.”
Crude Oil continues to build out within the 104.20 and 107.00 levels, which is a range that could offer a major breakout opportunity ahead. As a matter of fact, the daily chart shows a very tight four-day range that clearly suggests range contraction. What happens after contraction? Expansion! A true breakout from this range could spark the next major swing in this commodity.
The 104.20 level continues to hold as stern support, so price should be considered bullish above this level, which major resistance looming at 110 above. Short term, if price remains above 106.65, look to buy pullbacks, with targets at 107.11 and 107. 71. Below 106.65 forecasts 105.98 and 105.38.
Here are the targets for the current session and the week ahead:
| PivotBoss Levels & Targets: Crude Oil (CL) | |||||
| Jul 16, 2013 | |||||
| KEY LEVELS | ADR TARGETS | ||||
| 110.00 | Yearly R1 | ADR (5) | ONH | ONL | |
| 107.71 | Monthly R3 | 2.40 | 107.18 | 105.91 | |
| 107.46 | LVN | AWR (10) | WH | WL | |
| 106.89 | Fib Ext | 6.78 | 106.90 | 104.65 | |
| 106.60 | LVN | ||||
| 106.39 | PD High | DAILY TARGETS | WEEKLY TARGETS | ||
| 106.30 | SETTLE | BULL | BEAR | BULL | BEAR |
| 106.05 | LVN | 108.91 | 105.98 | 111.43 | 101.82 |
| 105.90 | VPOC | 108.31 | 105.38 | 109.74 | 100.12 |
| 105.68 | HVN | 107.71 | 104.78 | ||
| 105.08 | PD Low | 107.11 | 104.18 | ||
| 104.58 | Fix Ext | *BOLD indicates primary objectives | |||
| 104.30 | LVN | ||||
| 104.20 | LVN | ||||
| 103.52 | Open Gap | ||||
| 103.36 | Monthly R2 | ||||
| 103.34 | LVN | ||||
| 103.27 | nVPOC | ||||
Gold
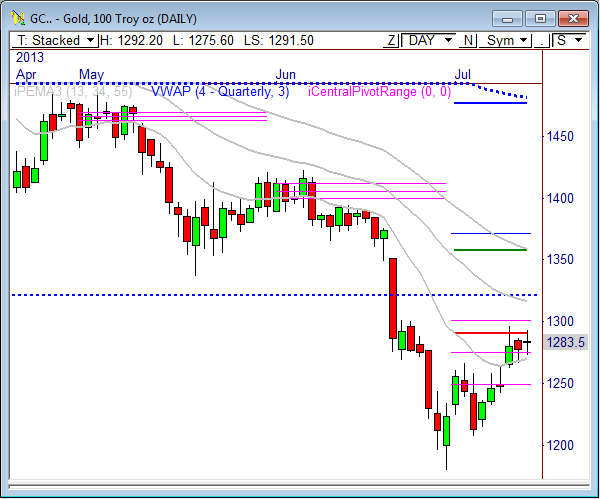
In Friday’s Gold report I wrote, “The daily chart shows price continues to push into the monthly pivot range, which also contains the monthly H3 Camarilla sell pivot. In a downtrending market, this is a hot sell signal.”
Gold continues to hold right in the middle of the monthly pivot range, seen in the daily chart. As I mentioned before, this zone is a major crossroad for Gold, as a rejection at this level, or a breakout above it, will lead to the next major swing move. I’m still leaning bearish, especially if Gold continues to have trouble with 1300.
The 60-minute chart shows a very similar pattern to Crude, as a tight 4-day range has developed. A breakout from this range will spark the next major move, so watch it closely: 1265 down, and 1300 up. Today’s bull targets to watch are 1294.6 and 1301, and today’s bear targets are 1280.3 and 1274.
Here are the targets for the current session and the week ahead:
| PivotBoss Levels & Targets: Gold (GC) | |||||
| Jul 16, 2013 | |||||
| KEY LEVELS | ADR TARGETS | ||||
| 1,316.50 | Fib Ext | ADR (5) | ONH | ONL | |
| 1,315.80 | 34PEMA | 25.4 | 1,293.00 | 1,275.60 | |
| 1,301.50 | Monthly TC | AWR (10) | WH | WL | |
| 1,292.80 | nVPOC | 90.30 | 1,293.60 | 1,272.50 | |
| 1,292.20 | Open Gap | ||||
| 1,291.10 | Monthly H3 | DAILY TARGETS | WEEKLY TARGETS | ||
| 1,290.80 | Fib Ext | BULL | BEAR | BULL | BEAR |
| 1,286.90 | LVN | 1,307.35 | 1,280.30 | 1,362.80 | 1,225.88 |
| 1,285.80 | PD High | 1,301.00 | 1,273.95 | 1,340.23 | 1,203.30 |
| 1,283.70 | SETTLE/VPOC | 1,294.65 | 1,267.60 | ||
| 1,283.60 | cVPOC | 1,288.30 | 1,261.25 | ||
| 1,272.50 | PD Low | *BOLD indicates primary objectives | |||
| 1,275.80 | Monthly Pivot | ||||
| 1,270.80 | LVN | ||||
| 1,267.40 | Fib Ext | ||||
| 1,260.80 | LVN | ||||
| 1,255.20 | HVN | ||||
| 1,254.10 | nVPOC | ||||
| 1,243.60 | LVN | ||||
| 1,234.30 | HVN | ||||
Pingback: The Fed and Narrow Ranges | PivotBoss