PB View
The S&P 500 futures are getting closer and closer to reaching 1700, but the pace has been snail-like. I’ve said this all week, but today could finally be the day. No, really. If price can remain above 1690, there’s a great shot to test 1700 today. But as I’ve mentioned before, I’m more interested to see how the market will react once this level is hit. I’m leaning toward higher prices toward 1710 before any real signs of selling are seen. But only time will tell.
Continue to watch Crude Oil and Gold, which have been huge movers lately. These two commodities, along with the Euro FX (6E), have been great trading vehicles lately – for both day and swing trading.
Remember, we New Home Sales and Crude Oil Inventories today, which could provide a little spark to the market this morning.
Cheers!
Frank Ochoa
PivotBoss | Own the Market
Follow me on Twitter: @PivotBoss
______________________________________________________
This daily report is currently free and open to the public, as I gather feedback and ideas ahead of a formal subscription offering later in the summer. If you have any feedback regarding anything in the report (good or bad) please provide it below in the comments section. Your comments will definitely help shape the report for the better. Thank you!
E-Mini S&P 500
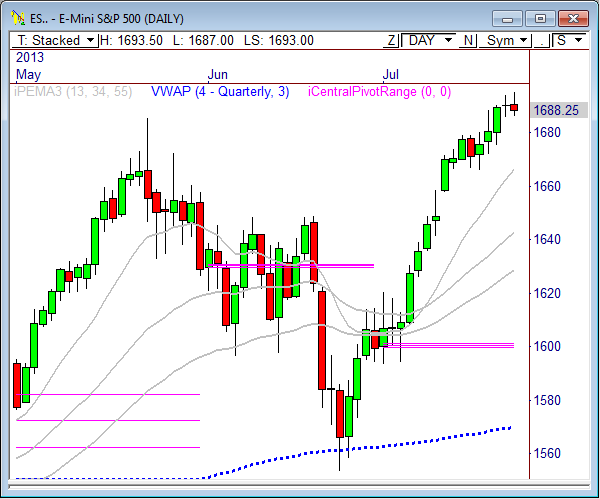
In yesterday’s ES report I wrote, “For today’s session, the 1692 to 1695.50 offers a short term range to watch for a breakout. Below 1692 sees 1689 and 1689.75, with a shot to retest 1686.”
The E-Mini S&P 500 opened Tuesday’s RTH session with a gap up, but was not able to find buyers above 1694, which resulted in a break of 1692 and the subsequent move to the low of the day at 1686 – right on the nose.
The boundaries for today’s early trade are set – 1686 and 1695.50. A breakout from this range will likely spark the day’s early move. An upside break through the overnight high (ONH) of 1695.50 forecasts a move from 1699.75 to 1703. Watch 1691.50 as the early pivot. A pullback to this level could be bought on first test, while a violation could lead to another key test at 1686.
The daily chart shows price is showing signs of exhaustion in the near term. I wouldn’t be surprised to see price sell-off after the first test of reaching 1700. But I also wouldn’t be surprised if the market rallied the ES to 1710, which has a nice confluence of levels that point to a test there before selling occurs, if selling should even occur. If a retracement occurs soon, a move to 1666.50 seems likely, with the potential to see another test of 1650.
Today’s scheduled economic news:
8:00am CT Flash Manufacturing PMI
9:00am CT New Home Sales
9:30am CT Crude Oil Inventories
Here are the Key Levels and Targets for the current session:
| PivotBoss Levels & Targets: E-Mini S&P 500 (ESU3) | |||||
| Jul 24, 2013 | |||||
| KEY LEVELS | ADR TARGETS | ||||
| 1,708.25 | Monthly R2 | ADR (10) | ONH | ONL | |
| 1,697.75 | Monthly H5 | 12.75 | 1,695.25 | 1,687.00 | |
| 1,697.00 | Fib Ext | AWR (10) | WH | WL | |
| 1,694.00 | PD High | 43.00 | 1,695.50 | 1,685.50 | |
| 1,693.00 | LVN | ||||
| 1,688.25 | VPOC | DAILY TARGETS | WEEKLY TARGETS | ||
| 1,688.00 | SETTLE | BULL | BEAR | BULL | BEAR |
| 1,686.00 | PD Low | 1,702.94 | 1,688.88 | 1,728.50 | 1,663.25 |
| 1,683.00 | Fib Ext | 1,699.75 | 1,685.69 | 1,717.75 | 1,652.50 |
| 1,682.75 | nVPOC | 1,696.56 | 1,682.50 | ||
| 1,679.25 | LVN | 1,693.38 | 1,679.31 | ||
| 1,677.25 | nVPOC | *BOLD indicates primary objectives | |||
| 1,673.00 | LVN | ||||
| 1,670.50 | nVPOC | ||||
| 1,670.00 | cVPOC | ||||
| 1,666.25 | LVN | ||||
| 1,664.25 | nVPOC | ||||
| 1,662.00 | LVN | ||||
| 1,656.00 | HVN | ||||
| 1,652.25 | LVN | ||||
| 1,648.75 | Open Gap | ||||
E-Mini NASDAQ 100
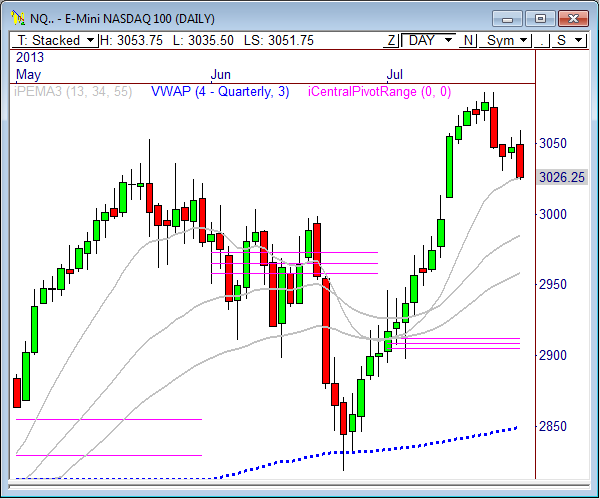
In yesterday’s NQ report I wrote, “Watch Monday’s range (3055 up, 3038 dn) for a potential breakout Tuesday, as a violation could provide some decent movement toward the day’s primary targets.”
The NASDAQ opened Tuesday’s RTH session with a gap up to 3054.50 and failed, sending price tumbling through the 3830 level en route to a low of 3023.50 by the end of the day. However, after hours and overnight trading has been bullish for the NQ, as price has already moved 30 points off Tuesday’s lows and even pushed beyond the 3055 level briefly this morning.
The 3055 zone will remain important today. If price can push through this level, and hold above it, we could see a push toward the day’s full ADR bull target of 3063.25, with an outside shot at 3070.25. If price cannot hold above 3055, then another move to 3043 and 3035 could be seen.
Here are the targets for the current session and the week ahead:
| PivotBoss Levels & Targets: E-Mini NASDAQ 100 (NQU3) | |||||
| Jul 24, 2013 | |||||
| KEY LEVELS | ADR TARGETS | ||||
| 3,096.00 | Monthly H5 | ADR (10) | ONH | ONL | |
| 3,086.00 | LVN | 27.75 | 3,057.25 | 3,035.50 | |
| 3,074.75 | cVPOC | AWR (10) | WH | WL | |
| 3,074.50 | nVPOC | 94.25 | 3,060.00 | 3,035.50 | |
| 3,066.25 | Fib Ext | ||||
| 3,062.75 | LVN | DAILY TARGETS | WEEKLY TARGETS | ||
| 3,054.50 | PD High | BULL | BEAR | BULL | BEAR |
| 3,043.00 | LVN | 3,070.19 | 3,043.38 | 3,129.75 | 2,989.31 |
| 3,035.00 | VPOC | 3,063.25 | 3,036.44 | 3,106.19 | 2,965.75 |
| 3,027.50 | LVN | 3,056.31 | 3,029.50 | ||
| 3,026.25 | SETTLE | 3,049.38 | 3,022.56 | ||
| 3,023.50 | PD Low | *BOLD indicates primary objectives | |||
| 3,011.75 | Fib Ext | ||||
| 3,008.00 | nVPOC | ||||
| 2,997.00 | Open Gap | ||||
| 2,995.00 | nVPOC | ||||
| 2,991.00 | HVN | ||||
Crude Oil
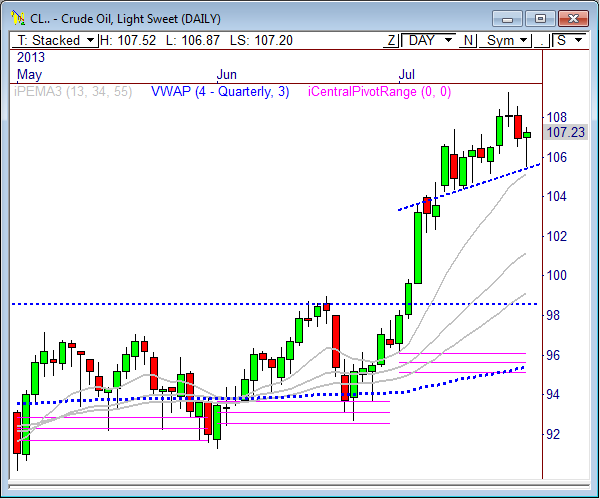
In yesterday’s Crude report I wrote, “A push into the 106.30 to 106.60 zone could be the first sell zone to watch early in the day. If this level holds as resistance, it could be another “sell the rips” day.”
Crude rallied into the 106.30 level early in the day and dropped straight away to the 105.59 level, providing a solid gain of 70 ticks on the move. I sold 106.29 and scaled out of half the trade at 106.08, and then took the last half off at 106.75, providing a great start to the session from this zone. However, price rallied beyond the 106.60 level later in the day, and eventually rallied to the 107.41 level, which was the high-probability adjusted ADR target on the day.
Looking at the daily chart shows Tuesday’s candlestick to be a bullish reversal tail. I would have thought that Crude would have seen a slightly larger retracement than this, but the commodity has been smoking hot lately, so a narrow pull-back seems about right. Look for buys to enter the market if price drops into the midpoint of the prior day’s range at 106.51 zone. If buyers defend this zone, we could see a nice swing move higher toward the 110 level over the next few days. Look to buy above this level, and sell below it. Keep in mind that Crude Oil inventories are released today at 9:30am CT, so that report could have a big impact.
Short term, watch the 106.90 level, which has become a level of interest over the last few session. Today’s primary bull target is 108.23, and the primary bear target is 105.95.
Here are the targets for the current session and the week ahead:
| PivotBoss Levels & Targets: Crude Oil (CLU3) | |||||
| Jul 24, 2013 | |||||
| KEY LEVELS | ADR TARGETS | ||||
| 110.00 | Yearly R1 | ADR (10) | ONH | ONL | |
| 108.32 | LVN | 2.09 | 107.52 | 106.66 | |
| 107.88 | Fib Ext | AWR (10) | WH | WL | |
| 107.71 | Monthly R3 | 5.90 | 108.79 | 105.80 | |
| 107.34 | cVPOC | ||||
| 107.34 | PD High | DAILY TARGETS | WEEKLY TARGETS | ||
| 107.23 | SETTLE | BULL | BEAR | BULL | BEAR |
| 106.78 | VPOC | 109.27 | 106.48 | 111.70 | 104.37 |
| 105.92 | PD Low | 108.75 | 105.95 | 110.23 | 102.89 |
| 106.53 | LVN | 108.23 | 105.43 | ||
| 106.05 | LVN | 107.71 | 104.91 | ||
| 105.97 | nVPOC | *BOLD indicates primary objectives | |||
| 105.74 | HVN | ||||
| 105.38 | Fib Ext | ||||
| 105.33 | LVN | ||||
| 104.37 | LVN | ||||
| 104.20 | LVN | ||||
| 103.52 | Open Gap | ||||
Gold
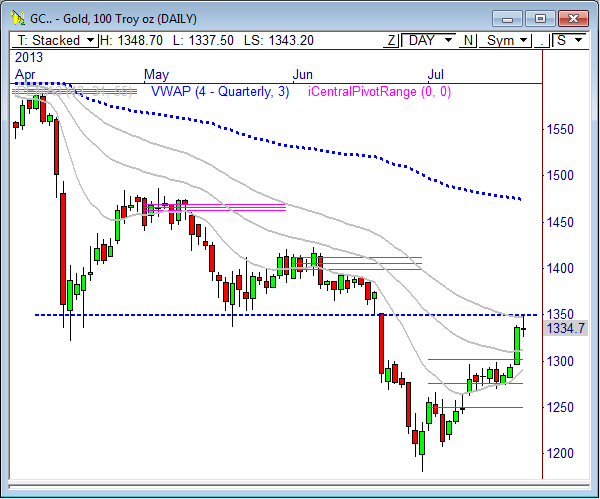
In yesterday’s Gold report I wrote, “Keep an eye on 1348 and 1360 above, which could be zones where buyers may begin to look to hand off their positions to sellers…Watch 1330 for early strength, with targets at 1338.10 and 1344.40.”
Gold traded quietly throughout most of its RTH session, but did break above the 1330 level and rallied to each of the targets mentioned above early in the afternoon before topping out at 1348.70. Gold has certainly been an extremely active commodity lately, which is a welcomed change from the rather low volatility that the E-Minis are providing on most days this summer.
For Wednesday’s market, watch the narrow range that has formed from 1338 to 1345. Price has coiled within this range since Tuesday afternoon and seems poised for a breakout later in the session. An upside push through 1345 forecasts 1349.80 and 1356, with a shot at 1362.20. A downside break through 1338 would introduce 1333.60, 1331.4, 1330.2, and 1325.
I’ll be watching the daily chart very closely, as price reached the 55-period pivot-based EMA yesterday. Remember, the three moving averages have been stacked and sloped during this downtrend, and tests at these levels can often result in a “sell the rally” effect. Another day, another big decision point at 1348. If price cannot rise beyond 1348, then a short term top could be in. Beyond 1348 opens up 1357.80.
Here are the targets for the current session and the week ahead:
| PivotBoss Levels & Targets: Gold (GCQ3) | |||||
| Jul 24, 2013 | |||||
| KEY LEVELS | ADR TARGETS | ||||
| 1,385.50 | cVPOC | ADR (10) | ONH | ONL | |
| 1,371.40 | Monthly R1 | 24.7 | 1,348.70 | 1,337.50 | |
| 1,357.80 | Monthly H4 | AWR (10) | WH | WL | |
| 1,347.00 | 55PEMA | 60.20 | 1,348.70 | 1,295.40 | |
| 1,345.20 | LVN | ||||
| 1,339.30 | Fib Ext | DAILY TARGETS | WEEKLY TARGETS | ||
| 1,338.00 | LVN | BULL | BEAR | BULL | BEAR |
| 1,336.20 | PD High | 1,368.38 | 1,336.35 | 1,355.60 | 1,303.55 |
| 1,335.20 | SETTLE | 1,362.20 | 1,330.18 | 1,340.55 | 1,288.50 |
| 1,333.60 | HVN | 1,356.03 | 1,324.00 | ||
| 1,331.40 | VPOC | 1,349.85 | 1,317.83 | ||
| 1,327.90 | PD Low | *BOLD indicates primary objectives | |||
| 1,326.40 | nVPOC | ||||
| 1,325.70 | LVN | ||||
| 1,324.70 | Fib Ext | ||||
| 1,310.00 | LVN | ||||
| 1,301.30 | Monthly TC | ||||
| 1,297.00 | LVN | ||||
| 1,292.70 | nVPOC | ||||
| 1,288.10 | LVN | ||||
| 1,283.80 | HVN | ||||
Pingback: Is 1650 Next? | PivotBoss