
Now that the S&P has reached the 1937 target, is price on track to reach 2425 or 1489 next? Here are my long term observations.
S&P Reaches 1937
The S&P 500 futures [CME: ESM14] finally reached the 1937 target I issued in early February, which I’ve written about for months, including in the May 6 edition of the Opening Print (Strong Lows Suggest Strength in the S&P) wherein I wrote: “Watch 1887 for signs of follow-through that could eventually lead the ES to the 1937.75 target we issued in February, with upside scaling targets at 1893.25 and 1904.”
Not only did the S&P futures reach 1937, they blew through this level and made it support almost immediately in the lower timeframes, showing the true strength of the market with each new all-time high. But how much higher can the S&P go? Now that the intermediate term target has been reached, I’ll offer some of my long term observations for the S&P.
Next Expansion Target is 2425
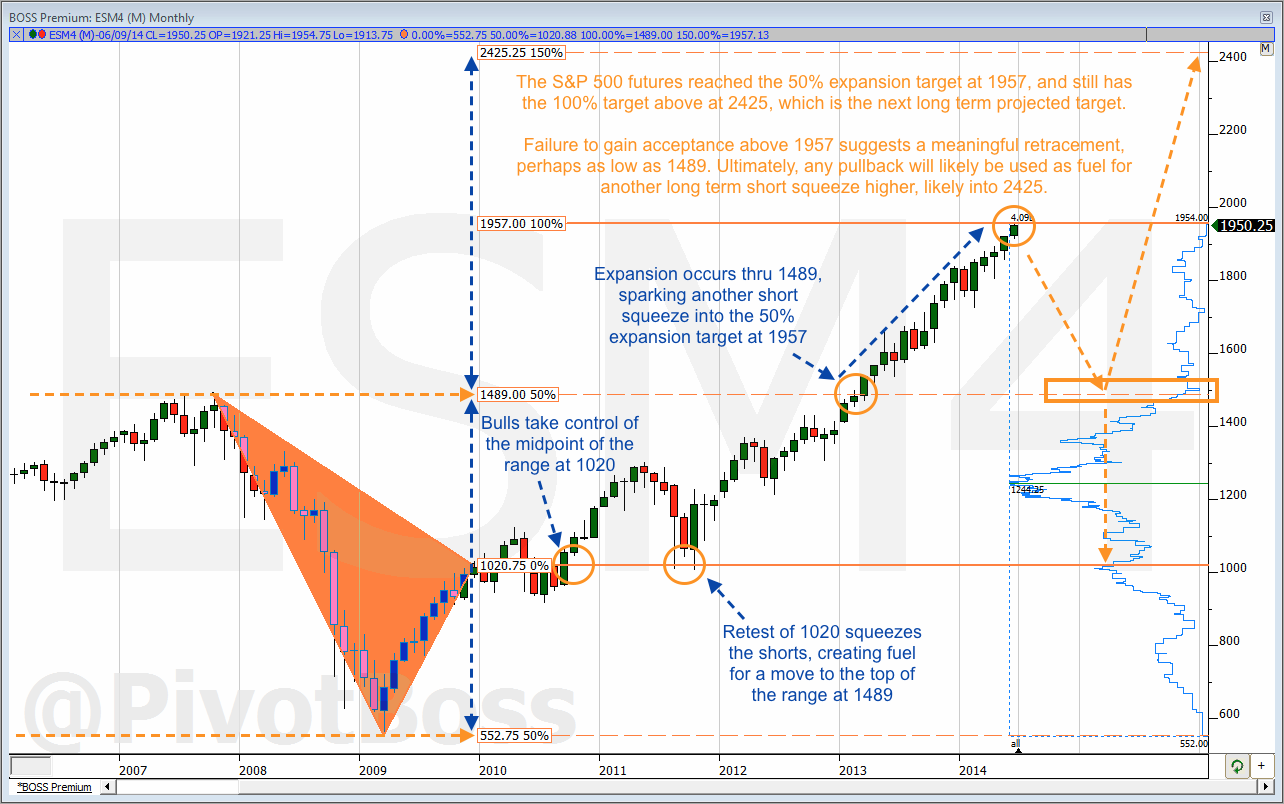
The continuous contract of the monthly chart shows the S&P 500 has come within 9 ticks of reaching the 50% expansion target of 1957 as of Monday’s session. This target is derived using the range that developed from 2007 to 2009. The S&P broke through the top of this multi-year range at 1489 at the beginning of 2013 and never once returned to retest this level, essentially triggering the mother of all short squeezes over the past 18 months.
Of course, the real target is still above. The 100% expansion target is 2425 and is the next long term projected target on the board. However, the market has squeezed the shorts to the tune of 465 points over the last 18 months without a significant multi-month pullback. Typically speaking, it would seem that a pullback may need to occur before a run at 2425 is seen. Needless to say, “typically speaking” hasn’t quite applied to the recent market, and anything still goes.
Is 1489 First?
Expansion targets offer great levels to take profits, which means they also make great levels for those looking to fade a new high or new low. More to the point, will 1957 be faded? This level is the first major expansion target to be reached in the monthly timeframe in a long while, so it would seem that profit-taking bulls coupled with eager bears could provide a recipe for selling pressure off this level.
Any such weakness would attract new bears, and if they can take out 1725, we could see further selling pressure into the top of our key range at 1489 over the course of the next 12 to 18 months. Ultimately, any weakness seen as a result of fading 1957 (or even as high as 2000) will likely be used as fuel for the next short squeeze, which could eventually lead price right into the 100% expansion target at 2425 down the road.
Long term, the S&P remains bullish and poised to reach 2425 over the next two to three years, but remains at risk for a longer term retracement. While the market has seemed over-extended for a year, this bull market has yet to test a significant level like 1957, or 2000 for that matter. This zone could finally provide the fuel needed for a retracement ahead of the next phase of strength. And if 1500 is eventually seen, it will likely be an all-time buying opportunity.
Cheers!
Frank Ochoa
PivotBoss | Own the Market
PivotBoss Premium | Premiere Analysis for Professional Traders
PivotBoss Masters | Premiere Training for Professional Traders