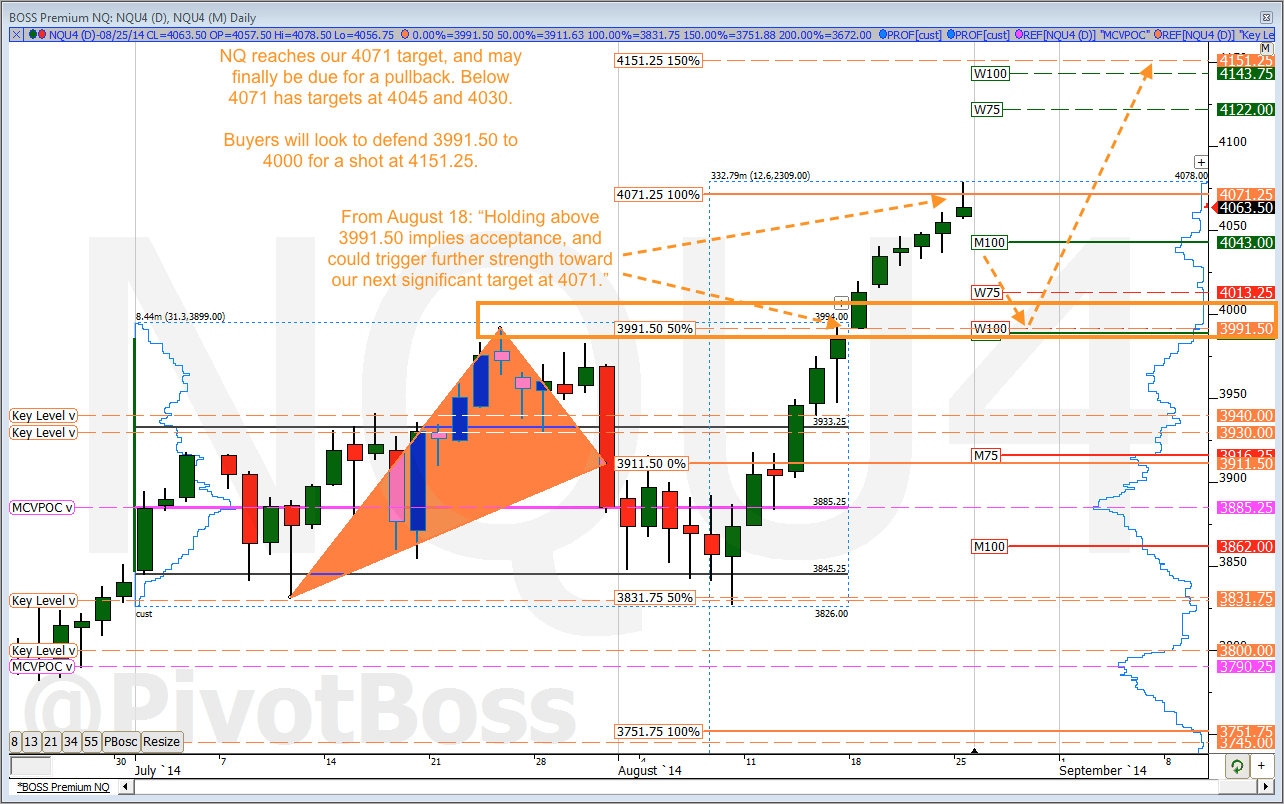
Nasdaq 100 reaches 50% expansion target at 4071; 4151 on tap.
NQ Rallies 250 Points
The E-Mini NASDAQ 100 futures [NQU14: CME] have rallied 250 points from the 3830 key level we called out in July…in just 12 sessions. Just last week, I wrote about the next upside target to watch at 4071, which was reached during Monday’s trading.
Here’s what I wrote last week (NQ Approaching 4071 Target): “The NQ is currently attempting to hold above the top of the range at 3991.50, which is the biggest key level to watch at present. Holding above 3991.50 implies acceptance, and could trigger further strength toward our next significant target at 4071, with scaling points at 4043 and 4055.”
If you recall, sellers were very active between 3975 and 3991.50 back in July. But when price popped above 3991.50, buyers immediately began to defend this level, thus making it support, and eventually ran the upside buy stops through 4000 and into our 4071 target.
So far, the NQ has been offered above 4071, and ended up closing Monday’s session below it at 4063.50. This may be the first indication of a pullback to come, which could push price into 4030, and even into 3991.50.
Buy the Dips
I’ve been a strong advocate for buying the dips at key levels during the current 18-month rally. And nothing has changed. While the NQ could see near-term selling pressure over the next few days, buyers will be looking to defend key levels for a shot at new highs into the 100% expansion target at 4151.25. Any pullback into 3991.50 to 4000 is likely to be defended by OTF responsive buyers looking to defend prior resistance for a shot at 4151.
Watch 4071.25 for early directional bias Tuesday. Failure to gain acceptance above 4071.50 implies weakness into 4045 and 4030. Above 4071 triggers stops into 4122, with 4151 above.
Cheers!
Frank Ochoa
PivotBoss Premium | Premiere Analysis for Professional Traders
PivotBoss Masters | Premiere Training for Professional Traders


Hi Frank. I really enjoy your analysis and believe you have an excellent feel for this market. Thank you very much for sharing your research with us. Maybe I missed it on the site, but can you share what charting package you use? The display is outstanding, with the distributions etc. Thanks!