

This is Part 5 of 5 in the Getting Started with Premium series
Our RT Playbooks are designed to provide Premium Members with prime intraday trading opportunities each morning ahead of the upcoming session, and are posted in a beautiful chart gallery for easy and convenient access during the trading day.
Our playbooks reveal trade opportunities directly onto the charts, for both bulls and bears, using hand drawn lines similar to a sports playbook.
The idea is to use these playbooks for trade ideas, and then to trade the opportunities that line up with your own analysis while using proper risk management. Ideally, traders using these playbooks will use a scaling approach to trade management, which allows a trader to scale out of positions to reduce, and ultimately eliminate, risk in the trade.
RT Playbooks are Posted Each Morning
Our Premium RT Playbooks are posted each morning from Monday through Friday ahead of the opening bell, typically by 8:00am CT. RT Playbooks are currently offered for the E-Mini S&P 500, E-Mini NASDAQ 100, Crude Oil, and Gold markets.
The playbooks are posted after the Pre-Market Report, and utilize the higher timeframe analysis and trade ideas from the report to build an action plan directly onto the charts for RT traders.
A Chart is Worth A Thousand Dollars
It’s often said that a picture is worth a thousand words. In the case of our RT Playbooks, a chart is worth a thousand dollars – both figuratively and literally.
As you’ll see below, our RT Playbooks highlight incredible trading opportunities on any given day, with moves surpassing $1000 on a per contract basis in a signal day. Again, not bad for a membership that costs just $99 per month.
These charts provide traders with key levels, potential entries, and forecasted targets for each market, and typically incorporate analysis that we’ve previously provided via the Premium Outlooks, EOD Playbooks, and Pre-Market Reports.
Anatomy of a Basic RT Playbook
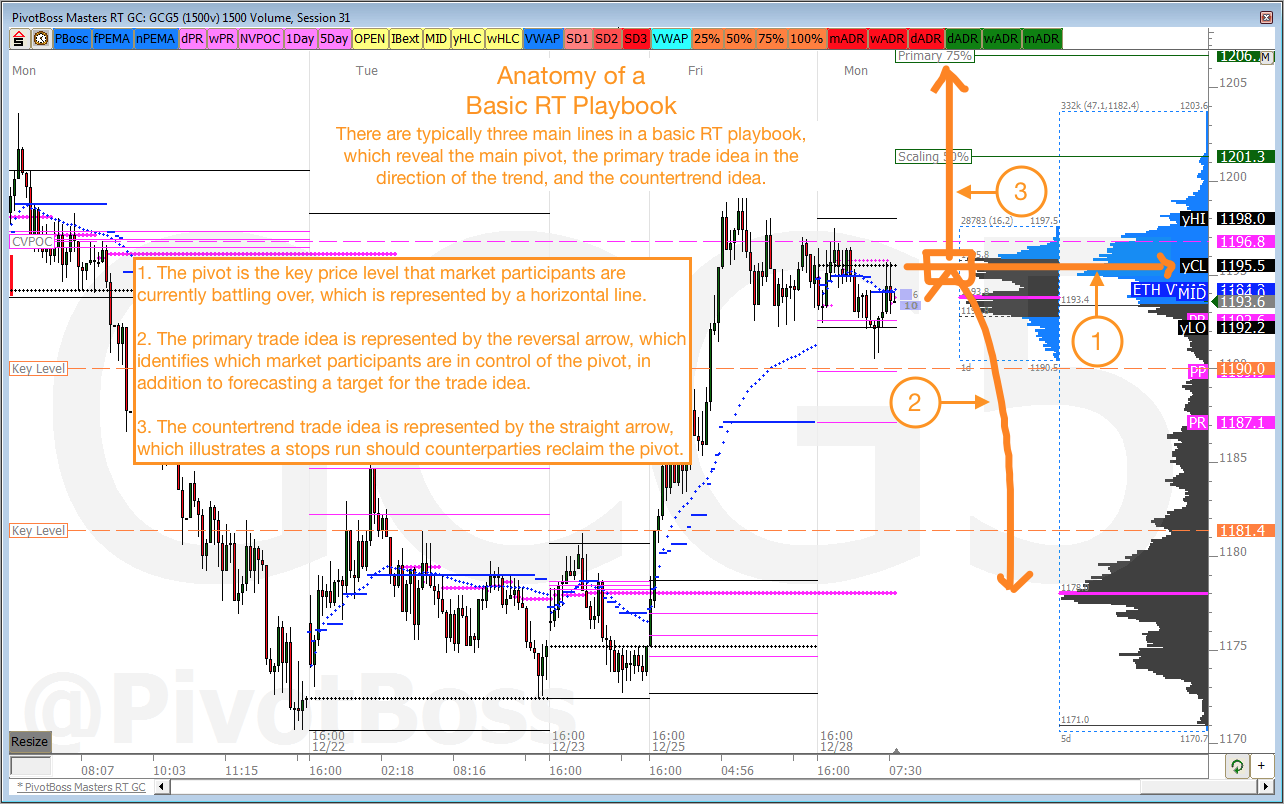
Let me explain the anatomy of a basic RT playbook, which reveals our forecasted blueprint for bulls and bears to use in the short term.
There are typically three main lines in a basic RT playbook. These lines reveal a pivot, the primary trade idea in the direction of the existing trend, and a countertrend idea.
The pivot is the key price level that market participants are currently battling over, which is represented by a horizontal line. The primary trade idea is represented by the reversal arrow, which bounces off the pivot and heads toward a forecasted target at the end of the arrow, or series of arrows. Lastly, the countertrend trade idea is represented by the straight arrow, which illustrates a stops run should counterparties reclaim the pivot.
Perhaps the best way to familiarize yourself with our RT Playbooks is to review some recent case studies.
Case Study 1: The Perfect Trade
There’s nothing better than nailing a trade idea for our Premium Members. This Gold playbook is a perfect example.
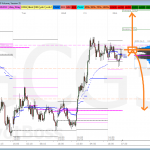
Regarding this Gold example, the horizontal arrow pointing to yCL (the previous session’s Close price) at 1195.50 is the pivot. The reversal arrow that bounces down off that pivot signifies that bears are defending that pivot and are currently in control. Essentially, this is the primary trade idea for this chart, and the end of the arrow points to 5-day VPOC at 1178, which is the target that bears are shooting for. Typically speaking, our goal is to identify rejection in the charts, with targets at areas of acceptance. In this case, rejection is occurring at the previous session’s close price, and bears are looking to return price to value at 5-day VPOC.
The straight line that shoots up from 1195.50 pointing to “Primary 75%” at 1206 is the secondary trade idea should bulls reclaim the pivot and squeeze the bears out of their positions.
What made this trade recommendation special is the fact that we identified the exact pivot that market participants were battling over, in addition to the exact target that bears were shooting for.
In just a matter of hours, Gold sold off from our pivot directly to our target for a move that spanned 17 points, or $1700 per contract traded.
Keep in mind, the goal is not to trade every RT Playbook recommendation that comes your way. Rather, the goal is to trade the ideas that make sense to you within the context of your own analysis, while maintaining a proper risk management approach that allows you to scale out of your position to reduce risk in the trade.
Preserving capital is always your number one goal, and proper trade and risk management is essential to accomplishing this goal.
Unfortunately, not all trade recommendations are perfect, but understanding how the market works will allow you to make money with RT Playbooks even when conditions appear less than perfect, as you’ll see in the case studies below.
Case Study 2: Acceptance Beyond the Pivot
The following RT Playbook provides an example that clearly illustrates when bullish counterparties were able to overwhelm bears that had been in control of the trend, thus triggering a short squeeze. Never underestimate the power of a short squeeze.
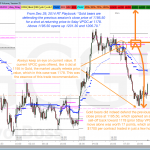
In this playbook, we identify the previous session’s close price of 1982 as the key pivot that bears were defending for a shot at new lows at 1955.75 and 1941.50, which is the primary trade idea as illustrated by the horizontal and reversal arrows. The secondary trade idea is a stops run beyond 1982 into the previous session’s high price of 2012.25.


As you can see from the second chart, price approached our primary sell zone of 1982, coming within 1 point of the level, before dropping into 1973s for an 8-point move.
However, bulls trapped bears at the previous session’s low price of 1974.50 and began to squeeze bears through 1982, converting it to support in the process. Bulls then defended 1982s from above on several passes, which eventually exhausted bears, sparking a short squeeze into the previous session’s high price, coming within 1 point of our projected target at 2012.25.
What’s important to note about this chart is that we identified the proper pivot for the morning, and both bulls and bears got paid off this level. But ultimately, it was the bulls’ ability to reclaim the pivot, which sparked a massive short squeeze of nearly 30 points, or $1450 per contract traded.
Case Study 3: Failed Defense of Pivot with Stops Run
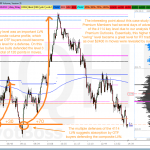
Here’s a playbook example that clearly illustrates a slam instead of a squeeze. In this example we identified 55 as the level that Crude Oil bulls were defending as support for a shot at the top of 5-day value above 56.38. Our secondary trade idea is a stops run through 55 into 53.94.
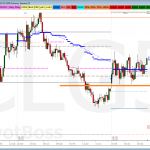
Just after the RTH Open, Crude Oil bounced perfectly off the 55 level and rallied 30 ticks into 5-day VPOC at 55.30 – a $300 move per contract traded.
However, bears defended VPOC and took it offered, which triggered a long liquidation through the 55 key level and into our downside target of 53.94 for a move of $1000 per contract traded. As a matter of fact, Crude sold off 2 points after breaking the 55 key level, which illustrates the power of a long liquidation when bulls don’t get paid off support.
Case Study 4: Failed Defense of Pivot with Stops Run
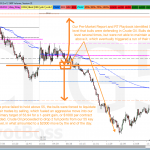
Here’s another example of how a failed defense of a pivot leads to a stops run – in this case, a long liquidation. The morning’s RT Playbook for Gold offered a primary objective of defending the pivot at 1207 for a shot at returning price to 1223 and 1233. The secondary objective was for bears to run stops below 1207, with targets at 1197 and 1190.


As you can see, price initially bounced off the 1207 pivot and pushed as high as 1213, which is a 6 point move ($600 per contract traded).
However, once price failed to push to a new highs beyond 1213s, the stops came out. Bulls ran for the exits, sparking a long liquidation through the 1207 pivot and into both of our pre-market downside targets of 1197 and 1190, completing our secondary trade recommendation for a precision move worth $1700 per contract traded.
Again, our goal is to identify the day’s early pivot in the charts, and then help our Premium Members understand how to handle the various scenarios that can arise throughout the day around these important pivots. In this case, bulls and bears both made money off 1207s.
Case Study 5: Swing Pivot Can Provide Multiple Opportunities
Oftentimes, the best intraday pivots for day traders to use are key levels that are derived from the daily timeframe, including key levels from the composite volume profile. The reason is because these key levels represent significant prices from higher timeframes, which means bigger players will be looking to deploy bigger positions at these price, which in turn leads to fantastic intraday movement off these key levels for day traders!
Here’s one of those examples when all week I was telling Premium Members that bulls would defend the 4114 key level on its first tests, because this level was a significant composite LVN from the daily timeframe. The idea was that higher timeframe traders would look to defend this level, and absorb supply from sellers looking to take out support
Simply put, the RT Playbook for the NQ showed our primary trade recommendation as defending 4114 for moves back to 4160 and higher.
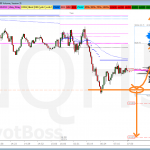
By the end of the session, responsive bulls had defended 4114s on multiple occasions for moves totaling 120 points.
Again, it all goes back to how we analyze the charts, and how we present this information to our Premium Members in a way that allows you to both learn the approach, and profit from the trade recommendations.
To study more of our prior trade recommendations, be sure to visit our Recent Winners.
Cheers!
Frank Ochoa
Author, Secrets of a Pivot Boss
PivotBoss | Own the Market
PivotBoss Premium | Premiere Analysis for Traders
PivotBoss Masters | Premiere Training for Traders
______________________
Start Your 2-Week Trial to Premium Today!