The major market indexes have experienced impressive bounces after testing key areas of support recently. They look poised to head higher, but the Russell 2000 Index may put a damper on the party.
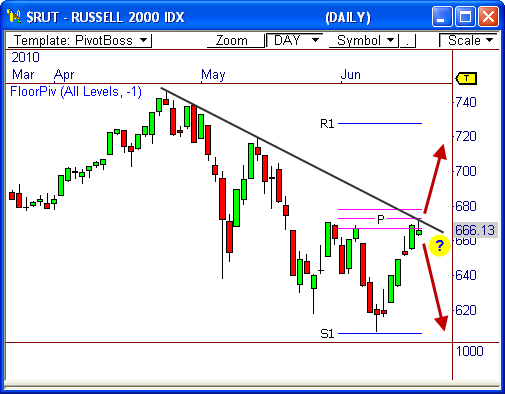
The daily chart of the Russell 2000 Index shows price has rallied nicely after testing S1 support at 607 a little over a week ago, covering about 60 points of ground in a mere six sessions.
No doubt, the bulls have responded to recent selling pressure in big fashion, but things could change quickly.
That is, the Russell 2000 has run smack into a major band of resistance at 672, which poses an interesting dilemma for the index: Breakout and continue higher, or reverse from resistance and restest lows?
The 672 level contains a medley of confluence – the monthly pivot range, the eight-week down trend line, and five-week visual resistance, creating a virtual brick wall of resistance.
If the index cannot close beyond 672, and preferrably 678, we could see a very sharp downside reversal that pushes price back toward 607 support.
For evidence of just how stinging the bearish reversals have been lately, look at the previous touches on the down trend line at 738 and 719 over the past two months.
As always, we must see a closing price below today’s low price of 662 in order to confirm a potential downside reversal.
Otherwise, a break through resistance at 672 leaves “clear air” above; likely back toward 719.
What’s your crystal ball say? Drop a line in the comments section below!
If you want to read more about Floor Pivots or the Pivot Range, read the following articles: A Quick Guide to Floor Pivots; A Quick Guide to the Pivot Range.
Cheers!
Frank Ochoa
PivotBoss.com
Follow Frank on Twitter: http://twitter.com/PivotBoss

