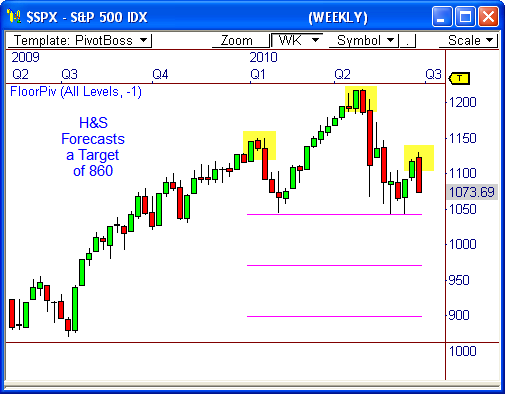
With the recent retracement in the S&P 500, talk of the developing head-and-shoulders pattern is likely to take center stage once again. Since the pattern forecasts a target of 860, it doesn’t hurt to take a look.
The weekly chart of the S&P 500 Index ($SPX) shows a pattern that has been discussed over the last three months – the large head-and-shoulders pattern. This pattern has a well-defined horizontal neck line at 1,040, which coincides with critical support and has been tested three times this year. If this pattern is broken to the downside, a significant decline could occur.
Traditionally, you would measure a target for a H&S by taking the distance from the neck line to the top of the head, and then projecting this differential from the breakout point of the pattern. Therefore, subtracting the May low of 1,040 from the April high of 1,220 gives you 180 points, which forecasts a target of 860 if the 1,040 level is violated.
Of course, there is still a lot of game left to be played. The index must drop another 34 points before a test at the neck line even occurs. Even then, we must see a confirmed close below 1,040 to trigger the pattern.
Also, since the entire market sees this pattern, we could see a scenario where a “Fake Out” occurs. In this case, a violation of the neck line would precede a bullish reversal, similar to a short squeeze.
We’ll continue to monitor the pattern as it develops. Eventually, this pattern could pave the way for big movement once direction is decided.
By the way, I’ve made it to South Padre Island! Forgive me if anything I’ve written sounds crazy…I’ll just blame it on the beer!
Check out the view from our amazing penthouse! Time to catch some rays!
Cheers!
Frank Ochoa
PivotBoss.com
Follow Frank on Twitter: http://twitter.com/PivotBoss


Pingback: Follow the $VIX | PivotBoss.com