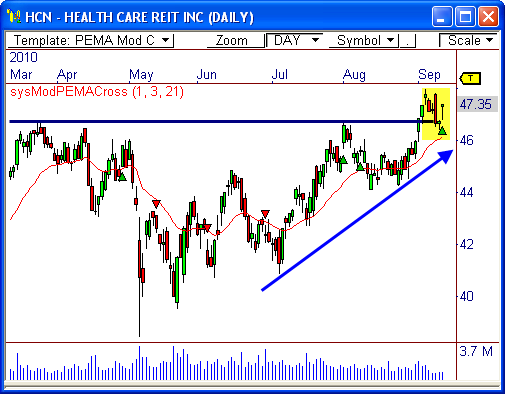
Health Care REIT, Inc. ($HCN) has been trending higher the last two months and has finally broken above key resistance. Current price behavior indicates the potential for a high-probability swing trade to $48.60. Here’s why..
Modified PEMA Crossover Signal
One of my favorite moving average-based signals has fired a Long in $HCN – the Modified PEMA Crossover signal, which I detail in my FREE eBook Profiting with Pivot-Based Indicators.
Basically, this signal fires pull-back opportunities in the direction of the existing trend. Since price has been trending higher for two months, each pull-back becomes a high-probability buying opportunity.
This type of signal usually yeilds a new high (or low) during a trending market, and is usually good for a move of between 1 and 5 bars (days in this case).
Look for a target at around $48.60.
Resistance Becomes Support
You’ll also notice that $HCN also broke above major visual resistance at $46.75, which had held since the end of 2008. The retest of resistance after the break shows that it may have already become support, which is bullish for this stock. If price can remain above $46.75, much more strength could be seen on a longer term basis for this issue.
The next highest resistance level must be found on a weekly chart during 2008 at $54, which could be the long term target for this stock.
However, for now, I’ll be focusing on the short term winner of $48.60.
Let’s see how this one plays out!
Cheers!
Frank Ochoa
PivotBoss.com
Follow Frank on Twitter: http://twitter.com/PivotBoss

