There’s no doubt that Wynn Resorts has been on a bullish tear lately. However, multiple timeframe confirmation indicates that much more strength could be ahead for this stock. Here’s why..
Daily Chart Breakout
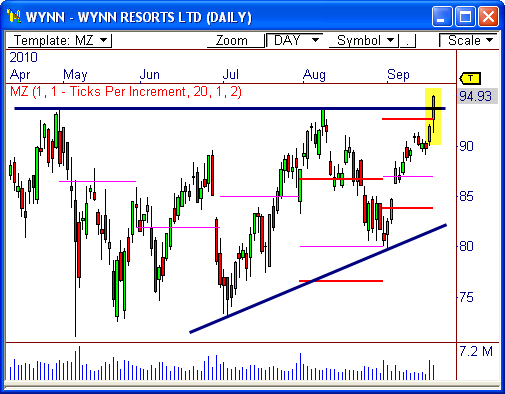
The daily chart of $WYNN shows price got a major breakout through the top of a large ascending wedge at $94 during yesterday’s market. This breakout also coincided with a break above the monthly Value Area High (VAH), which means initiative buyers will begin to enter the market to push price to higher value.
Therefore, a 5-month visual resistance level, a bullish ascending wedge, and the VAH were all violated in one day, creating a powerful form of bullish confluence.
If price remains above $90, we could easily see a break above $100 soon.
Weekly Chart Breakout
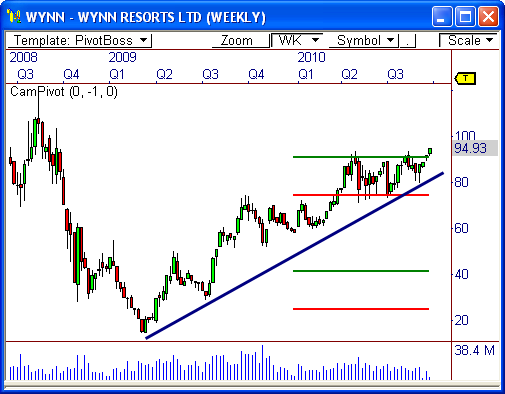
The weekly chart shows price has been trending steadily higher from the $15.00 level early in 2009. Over the last five months, price has basically traded in a large range from $75 to $94 below the yearly H4 Camarilla breakout level. However, the current weekly bar is beginning to push above H4, indicating another breakout opportunity.
Given recent price structure, we could see an upside continuation back toward the next area of resistance, which spans from $115 to $122, especially if price remains above the long term lower trend line.
Let’s see what happens!
Cheers!
Frank Ochoa
PivotBoss.com
Follow Frank on Twitter: http://twitter.com/PivotBoss


