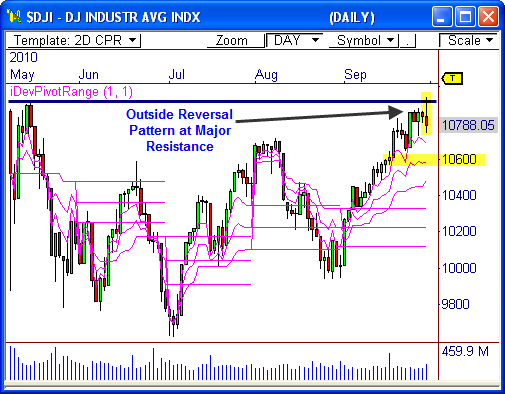
The Dow Jones Industrial Average ($DJI) has remained within a resilient bull trend since the test at 10,000 in August, rallying 1,000 points from this level in five weeks. However, we could see a modest retracement before the next wave of strengh enters the market.
Resistance
The daily chart of the $DJI shows price has pushed steadily higher the last five weeks, but has now run smack into overhead resistance at 10,920, which is a level we’ve had our eye on. The fact that the $DJI found immediately selling pressure above 10,920 is indicative of a short term wave of weakness ahead.
Moreover, yesterday’s daily bar shows a bearish Outside Revesal candlestick, which occurs when yesterday’s high price is above the prior day’s high, and the close is below the prior day’s close. This type of candlestick usually signals a decisive reversal ahead. If price closes below yesterday’s low of 10,745, we could see more selling pressure ahead.
This would actually fall in line with profit-taking after the biggest gain in September in decades.
10,600
The Developing Pivot Range indicator reveals the central pivot range for the month of October will have a Higher Value relationship, which means the pivot range for October is completely higher than the pivot range from September. In an uptrending market, we would expect a test back at the range at around 10,600, or even as low as the bottom of the range at 10,485, before another wave of buying pressure enters the market.
Therefore, we could see a drop back toward 10,600 to 10,485 before the “buy the dip” crowd deploys their capital. If this occurs, we could see another push to new highs within the current uptrend.
Given yesterday’s wide range of price movement, we could see a rather narrow range of trading today. However, a close below 10,745 could trigger a move back toward 10,600, which could ultimately lead to another great buying opporutnity.
Let’s see how this plays out!
Cheers!
Frank Ochoa
PivotBoss.com
Follow Frank on Twitter: http://twitter.com/PivotBoss


