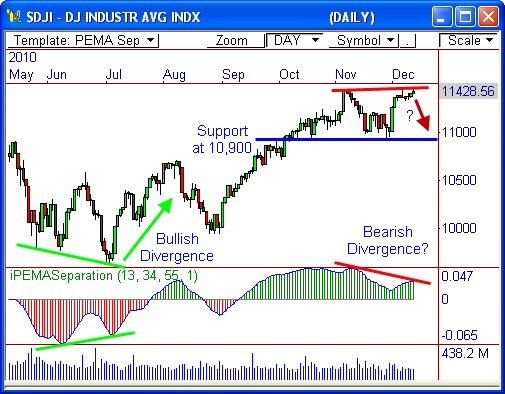
The Dow Jones Industrial Average ($DJI) reached new yearly highs today, topping out at 11,480.03. However, the index may have put in a temporary top, as we could see a short term reversal ahead. Here’s why..
Resistance
The Dow has run into major, two-month resistance between 10,450 and 10,480. The first test of this zone occurred in November, which promtly led to a sharp sell-off back to the 11,000 support level.
So far, the index has held beneath resistance for about a week without a breakout nor reversal – but this could soon change.
Bearish Divergence
A bearish divergence is beginning to develop between price and the PEMA Separation indicator. This indicator measures the distance between three pivot-based moving averages (the 13-, 34-, and 55-period EMAs), which helps to give clues about the general strength or weakness of a stock, future, or index.
The $DJI and the indicator both made new highs in November, however, the Dow put in a new high today with the indicator creating a lower high. This divergence could mean the index is headed lower.
Back in July, the Dow developed a bullish divergence, which led to a solid 1,000 point rally in the four weeks that followed.
Could we see the same type of reaction ahead?
If the index cannot rise above 10,500 soon, we could be looking at a test back toward two-month support between 10,900 and 11,000. Watch 11,325 for signs of bearish confirmation.
I’m not sure how much the market will move heading into the holidays and the end of the year, but it’ll be fun to see how this one plays out!
Cheers!
Frank Ochoa
PivotBoss.com
Follow Frank on Twitter: http://twitter.com/PivotBoss


