Terex Corporation ($TEX) is testing two-year highs and has run into a major confluence of resistance, which could lead to weakness ahead. Take a look..
Confluence of Resistance
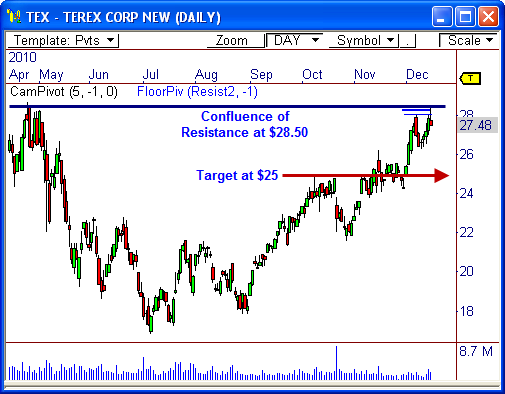
The daily chart shows $TEX is testing the high for the year between $28.50 and $28.70, which has been tested in April and December. Not only is this zone visual resistance, but it also has monthly pivot resistance, with R2 and H5 of the Floor Pivots and Camarilla Equation, respectively.
The fact that price is already beginning to show signs of weakness away from this zone indicates a potential profit-taking spree make take place – one that could push price back toward $25.00.
If price cannot close beyond $28.50, look for a quick drop back toward $26.25, with the potential to drop to $25.00.
Yearly Pivot Resistance
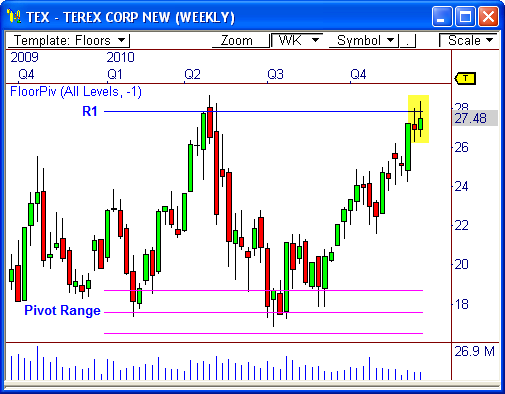
The weekly chart shows that $TEX is also testing yearly pivot resistance, as well. Price has honored the yearly Floor Pivots throughout 2010, keeping between the pivot range and R1 resistance the entire year.
Currently, price is testing the yearly R1 resistance level, which lies at $27.84. The fact that price has not been able to close beyond this pivot on a weekly basis is important, as another wave of weakness could be seen ahead.
Continue to watch resistance very closely over the next few weeks, as any signs of selling could easily lead to a test of $25.00 ahead.
Let’s see how this one plays out!
Cheers!
Frank Ochoa
PivotBoss.com
Follow Frank on Twitter: http://twitter.com/PivotBoss


