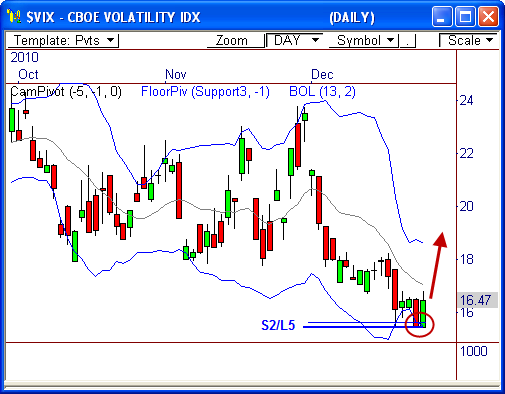
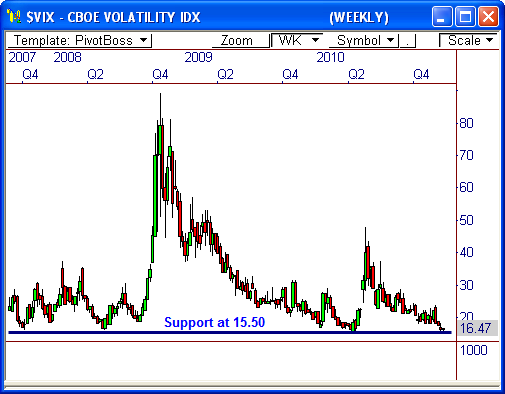
The CBOE Volatility Index ($VIX) is testing a confluence of support in the 15.50 zone, which could ultimately lead to a bullish reversal in this index. Such a move could have an adverse affect on the major market indexes. Here’s why..
The $VIX Reversal Signal
The $VIX is currently on part 2 of a 3-part reversal signal. If you recall the blog I wrote in June (Follow the $VIX), when the $VIX closes outside the lower boundary of the Bollinger Bands indicator, a very strong reversal in price could be seen ahead.
[From June 30]: Essentially, when the $VIX closes outside one of the Bollinger Bands, this is the first sign that a potential reversal could be seen in the $VIX, thereby having the opposite reversal effect on the broader market.
The $VIX closed outside the bottom of the Bollinger Bands indicator two sessions ago, and then closed back inside the indicator the very next session. If the $VIX closes above Thursday’s high print of 16.86, we could be on our way to a push higher in the index, which could lead to weakness in the broader market, like the S&P 500.
Confluence of Support
Adding to the potential reversal is the fact that the $VIX is sitting on three year support at 15.50, which has held since late 2007.
Every test at this support level has led to a key reversal in price, with a subsequent decline in the broader market averages.
To boot, the 15.50 area also happens to be the monthly L5 and S2 support levels in the Camarilla and Floor pivot indicators, respectively.
If the $VIX can hold above 15.50, we could be looking at a reversal that pushes price up toward 18.50, with the potential to rise as high as 24.00. Such a move could lead to a two-week correction in the broader market averages, so keep this in mind.
Let’s see how this plays out heading into the final week of the year, and the beginning of 2011.
Cheers!
Frank Ochoa
PivotBoss.com
Follow Frank on Twitter: http://twitter.com/PivotBoss


