The mini Dow futures contract has endured steady selling pressure in the last week of trading. However, this sell-off could lead to a great buying opportunity ahead.
Long Term Trend Line
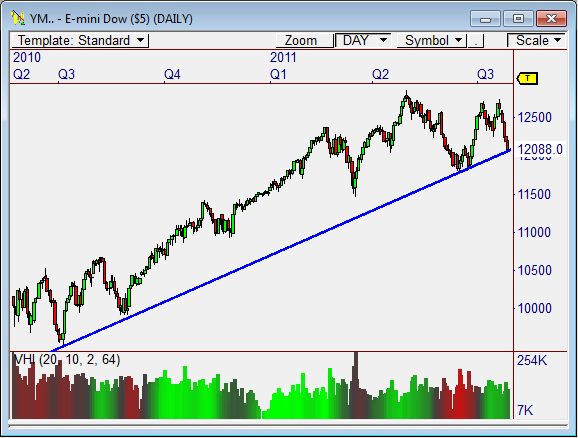
The daily chart shows the YM is testing the long term trend line that has formed beneath the lows of the 13-month advance, which began in July 2010.
Buyers have stepped in every time this line has been tested. Will buyers step in again? If 12,000 holds, I’d say yes.
Keep an eye on this line moving forward. Buyers will likely defend this line, even if a slight break does occurs. If 12,000 holds, we could see a very bullish move ahead – one that leads to a move toward the 14,000 level. But 11,800 to 12,000 needs to hold.
VWAP Bands Support
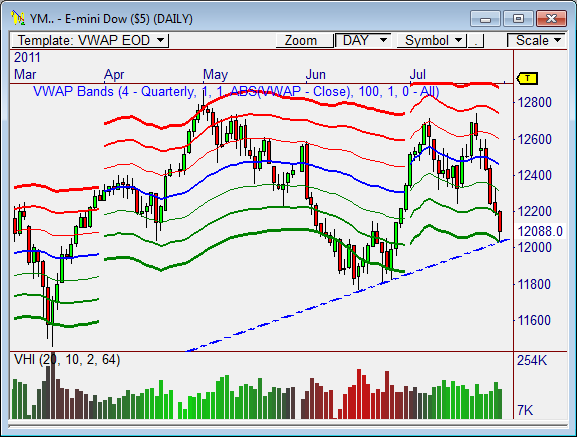
A zoomed-in version of the daily chart shows price is testing the S3 support level in the quarterly VWAP Bands indicator – which currently stands at 12,030.
This test indicates that price is clearly oversold in the near-term, which is usually a call to action for buyers.
If the lowest standard deviation band continues to hold, we could easily see a short term bounce that sends price back toward the quarterly VWAP level of around 12,450 – and potentially higher.
Keep an eye on 11,800 to 12,000. If long term buyers step in, we could be looking at a 2,000 point rally from current levels in the months ahead.
Let’s see how this plays out!
Cheers!
Frank Ochoa
PivotBoss.com
Follow Frank on Twitter: http://twitter.com/PivotBoss


