The mini-sized Dow futures contract is beginning to show signs of impending weakness. Here’s why the Dow could drop several hundred points in the days ahead..
Quarterly VWAP Resistance
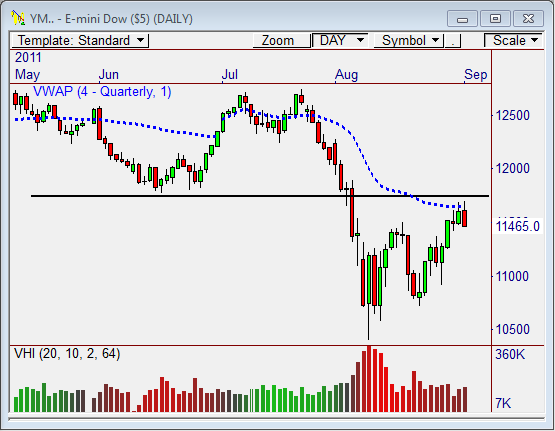
The daily chart of the YM futures contract shows price has tested quarterly VWAP the last two days, without being able to close beyond this powerful area of resistance.
The quarterly VWAP indicator begins its calculation on the first day of a new calendar quarter (July in this instance) and finishes on the last day of the quarter – which will be on the last trading day in September.
This variety of VWAP gives a very important view from a longer term perspective.
Typically speaking, when price drops sharply and then returns to test VWAP from underneath, a unique selling opportunity arises. Basically, responsive sellers are likely to enter the market because of they perceive price to be overvalued given recent price movement.
If price cannot rise above the quarterly VWAP level of 11,645, then we will likely see a sharp sell-off away from this zone in the days ahead.
Outside Reversal
Today’s price action also caused the formation of a bearish Outside Reversal candlestick setup in the daily chart, which occurs when today’s high is above yesterday’s high, and today’s close is below yesterday’s low.
This setup typically indicates a major downside reversal ahead, so keep an eye out for potential selling opportunities.
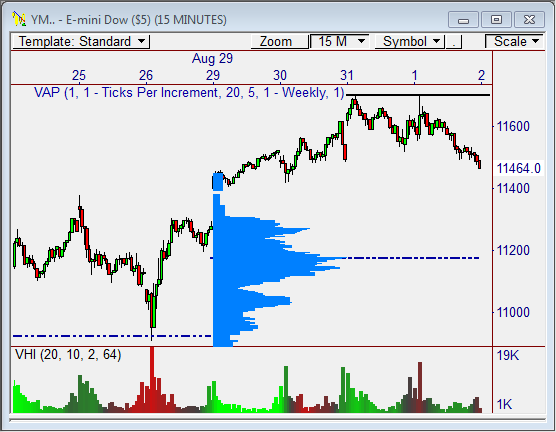
Couple this setup with the fact that price has been firmly rejected at visual resistance at 11,700 the last two days (seen in the 15-minute chart below), and you have a formula for a sell-off.
Where is Price Headed?
Down. If price cannot rise above 10,700, look to short into any strength tomorrow. If price drops below 10,400, we could see an easy first level target of 11,200, followed by 11,000 in the days ahead.
This 15-minute chart shows the static weekly VPOC (Volume Point of Control) is just below 11,200, which is where price is likely headed. Use this zone as a first level target, with the potential for a test at 11,000.
If, however, price breaks through the 11,700 zone, there is more overhead resistance to contend with at 11,750, so keep this in mind.
This could get very interesting tomorrow.
Let’s see how this one plays out!
Cheers!
Frank Ochoa
PivotBoss.com
Follow Frank on Twitter: http://twitter.com/PivotBoss


