After digesting Wednesday’s sell-off, The E-Mini S&P 500 looks poised for its next big breakout move. Here’s why..
Inside Day & PEMA Support
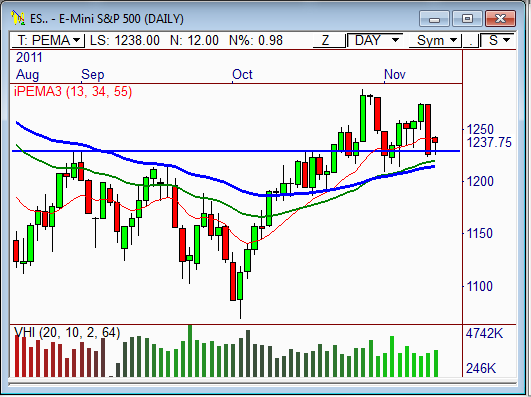
The daily chart of the ES shows price has formed an Inside Day pattern, whereby the current day’s trading range developed within the prior day’s range. This two-day pattern usually helps to forecast significant breakout opportunities in the day that follows.
If a breakout from Thursday’s price range occurs, look for a potential trend day to develop.
The daily chart also shows the ES has significant PEMA support between 1,214 and 1,219. These pivot-based moving averages have held as support ever since the bull crossover in mid-October.
If price remains above 1,214, we will likely see another round of strength back toward prior highs between 1,270 and 1,275, with the potential to push even higher.
Inside Value Relationship
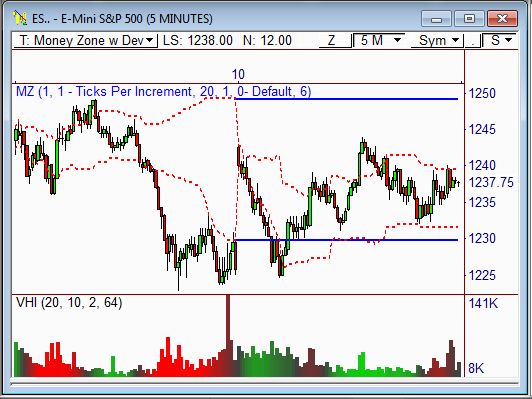
The 5-minute chart shows the ES has formed an Inside Value relationship, which occurs when the upcoming day’s Value Area develops within the prior day’s Value Area.
Much like the Inside Day pattern above, this relationship usually helps forecast a significant breakout for the upcoming session.
Ideally, an explosive breakout move will occur following an open that gaps outside the prior day’s price range – so watch 1,244 and 1,224.50 closely.
Currently, the 10-day Average Daily Range (ADR) of the ES is 30.5 points, which means the contract has averaged a 30.5-point range over the last ten trading days.
However, when an Inside Value relationship occurs, you can typically expect a bigger price range than normal. In this case, add 25% to the 10-day ADR to anticipate Friday’s price range should a breakout occur.
In essence, if we see a major breakout move tomorrow, look for price to move between 38 and 40 points.
Let’s see how this one plays out!
Cheers!
Frank Ochoa
PivotBoss.com
Follow Frank on Twitter: http://twitter.com/PivotBoss


