Gold has been extremely bullish the last three years, but has been virtually stagnant the last few months, which could lead to an impressive move ahead. Here’s a short and long term Gold outlook that could prove very rewarding..
Short Term Outlook
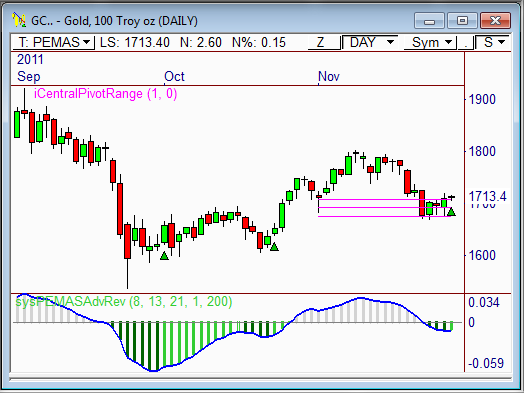
The Daily chart of the Gold futures contract shows price has been rather flat the last three months, with a net loss of about 4% during this time. However, price looks poised to push higher the next two weeks.
More to the point, a new buy signal has developed after Tuesday’s trading, which indicates a near-term push to prior highs at around 1,800 could be seen. This buy signal was generated using multiple pivot-based moving averages and calculating the separation (or distances) between them.
In essence, each signal indicates a pull-back opportunity within an established trend.
If price remains above the bottom of the central pivot range (shown in pink), we are likely to see a swift advance to 1,800, with the potential to exceed 1,900 in the months ahead.
Signal Accuracy
This signal tends to be very accurate, especially during fluid, trending markets – like the one seen in Gold.
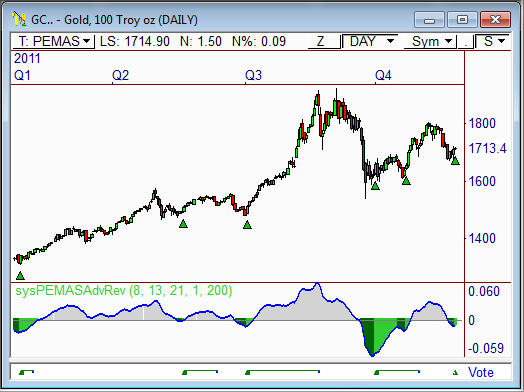
As a matter of fact, the last five signals since January have all been highly profitable, with a couple of signals doing exceedingly well. If the trend holds true, the current signal could prove profitable, as well.
The Daily chart below shows how the previous signals have fared in Gold over the last year.
Long Term Outlook
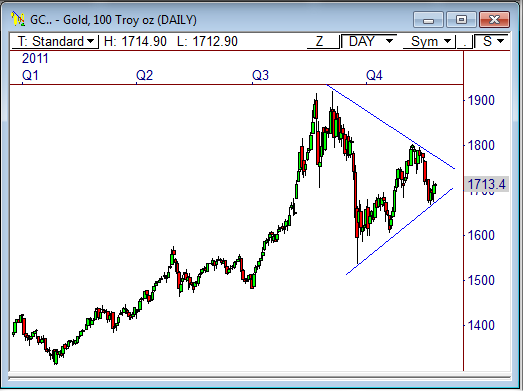
The Daily chart shows a large, developing triangle pattern, which could hold the key to the next major move in this commodity.
As a matter of fact, the triangle forecasts a move of about 390 points – which is huge! Therefore, once a breakout from the pattern occurs, we could see a significant 390-point move in the direction of the break.
The fact that the triangle has formed within the existing bull trend usually indicates a continuation. Therefore, the most likely breakout will be to the upside. If price breaks through 1,800, look for a continuation toward a forecasted target of about 2,190 in the months ahead.
A failure through the bottom of the pattern at 1,665 forecasts a target of 1,280, which would be quite a collapse.
Look for further development of the pattern, and wait for a decisive breakout. This pattern could be highly rewarding.
Cheers!
Frank Ochoa
PivotBoss.com
Follow Frank on Twitter: http://twitter.com/PivotBoss


