I wrote an article earlier this year that predicted the S&P 500 Index could be headed to 1,550 in the upcoming six to nine months. After a blistering start to the year, the S&P 500 has charged steadily higher and is now testing the critical 1,370 level, which we’ll want to keep a close eye on in the days ahead.
Massive Triangle
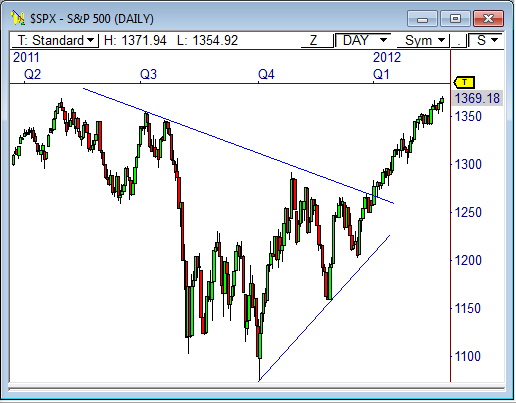
The daily chart of the $SPX shows the index opened 2012 with a solid breakout from the large triangle pattern at 1,270. Since the back end of the triangle measures 280 points, it’s conceivable that an upside target of 1,550 could be reached down the road. After all, the way this triangle pattern had coiled in the preceding nine months was a dead giveaway that fireworks could be seen in this index.
1,370 Resistance
The fact that price has rallied out of this pattern for 10 straight weeks indicates the bulls have clearly taken over.
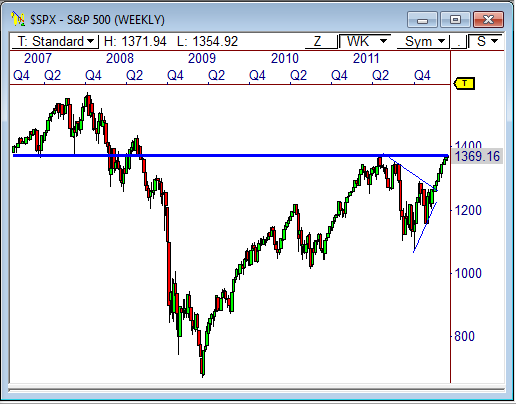
However, the next major area of resistance at 1,370 is an important level of contention. You see, the 5-year chart of the index shows 1,370 has been a major level of both support and resistance during this time. The fact that price was firmly rejected at 1,370 in 2011 (the high for the year, by the way) indicates the market will proceed to this level with caution ahead of the next major move.
If the market is going to find near-term weakness, I believe it will be around the 1,370 zone.
1,550 Remains the Target
However, even if the market sells off from current levels, continued strength is likely to be seen ahead.
As a matter of fact, a retracement would probably be healthy for the index at this point. Also, we’re only two months into a six to nine-month prediction, so there’s plenty of time for the S&P 500 to reach all-time highs in the 1,550 to 1,565 zone, despite any pull-back that may occur.
While near-term weakness could be seen in the days ahead, the S&P 500 should continue to remain bullish so long as it maintains its stance above 1,250 to 1,270.
ADR Method Webinar
You may have already heard, but tomorrow I’m giving a live ADR Method webinar for those of you that buy the DVD course by Feb 28.
The ADR Method helps you forecast intraday targets with amazing precision – up to 87% accurate in the backtest period!
What’s great about this method? It’s based on price, which means regardless of the market’s current volatility or behavior, this method will continue to work.
It’s just $49.50, but not for long. Get in while the price is still cheap, and secure your seat at the webinar table for tomorrow’s event!
>>> ORDER HERE <<<
See you soon!
Cheers!
Frank Ochoa
Follow Frank on Twitter: http://twitter.com/PivotBoss


