E-Mini S&P 500
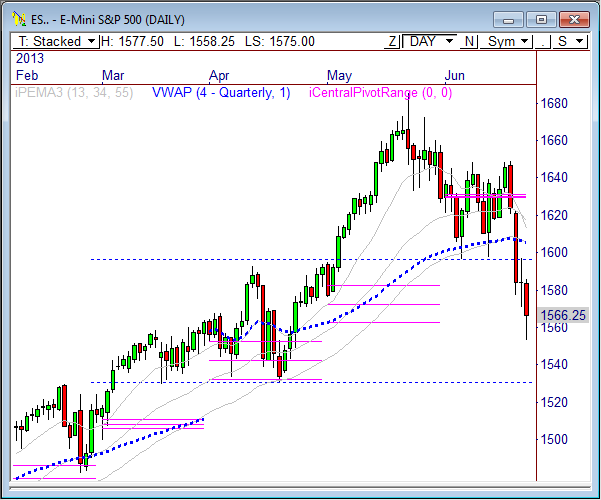
Monday’s opening price action was very bearish, as the E-Mini S&P 500 futures plunged nearly 18 points after the opening gap down. However, a midday reversal led to an extremely bullish run to 1,580 before selling off back to 1,566 into the close.
The midday rip was big, and definitely has me thinking we could see another round of short term strength back toward 1600. However, any rally into 1600 will be a major test for the market. Will the bulls be able to push past this level? Or will the bears look to defend this level and attempt to push the market back toward the next support zone of 1,530?
Typically speaking, when the market breaks a major technical support level, a retest of that level from underneath is usually sold, thereby sparking a bigger round of selling. If this case doesn’t play out, however, it will tell me the market remains extremely bullish. Only time will tell.
Long Term
The ES hit a major Fib level in Monday’s market at 1556.25, which is likely what helped initiate the midday rally. Taking the November 2012 low to the May 2013 high shows longer term Fib levels at 1556.25, 1513, and 1469.75. So far, the bulls were able to defend the 38% level on the first test. If will be interesting to see what happens should this level give way, as the next key Fib level is 43 points lower.
If 1550 continues to hold in the ES, we could see another major leg of strength ahead, which would actually forecast new highs for the year. However, being as though we are headed right into the teeth of the summer months means there likely won’t be enough real trading activity to actually fuel such a move. As I always say, however, the market will do what it wants, and will do so in a way that takes most traders by surprise. So it’s definitely not out of the question that we could push higher from here.
The key will be 1612.75. Can the bulls rally price over this level? If so, we could see another test at 1650 ahead. There is a ton of overhead resistance right now, and I think the market will have a tough time with 1590 to 1600, so this is the zone that I will focus on from a near term perspective.
For Tuesday’s Market
The ES dropped in after hours trading behind the early weakness of the Asian markets, but staged a bull run off the overnight lows of 1558.25, and are currently holding above the 1570 level as of the time of this writing. Given that the current 10-day ADR is 28.35, a full range move would target the 1586.50 level, but watch 1579.50 as the primary bull target.
The ES has formed a lower value relationship, but will likely open the session above the day’s value area, which is short term bullish. Watch 1590 to 1595, as a test at this zone will likely find resistance early on, while a drop into 1565 to 1570 could find near term support.
There are several key economic reports that traders will be watching today, which could influence price action:
7:30am CT: Core Durable Goods Orders m/m
9:00am CT: CB Consumer Confidence
9:00am CT: New Home Sales
Trade Update
I’m still short the ES from 1600 and still maintain a theoretical average entry of 1618.50 after scaling out of the bulk of my trade. I’m still targeting 1530, but that could change depending on what happens on a potential retest of overhead resistance. If price is firmly rejected on the first retest, I could move my target down to 1513. On the other hand, if the bulls regain control and price smashes through overhead resistance, I’d be looking to preserve profit. For now, I’m going to keep my current stop in place, although I’m strongly considering 1600.75.
SHORT: 1600
Profit/Loss: +26 Points
Objective: 1530
Stop: 1613
Breakeven Point: 1618.50
Here are the targets for the current session and the week ahead:
| PivotBoss ADR Targets for: E-Mini S&P 500 (ES) | |||||
| Jun 25, 2013 | |||||
| ADR (10) | ONH | ONL | AWR (10) | WH | WL |
| 28.35 | 1,577.50 | 1,558.25 | 60.00 | 1,586.25 | 1,553.25 |
| DAILY TARGETS | WEEKLY TARGETS | ||||
| BULL | BEAR | BULL | BEAR | ||
| 1,572.43 | 1,563.33 | 1,598.25 | 1,508.25 | ||
| 1,579.51 | 1,556.24 | 1,613.25 | 1,493.25 | ||
| 1,586.60 | 1,549.15 | ||||
| 1,593.69 | 1,542.06 | ||||
| *BOLD indicates primary objectives | |||||
E-Mini NASDAQ 100
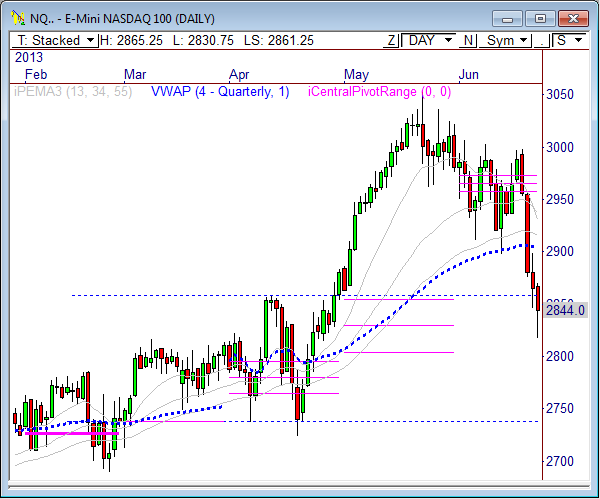
Like the ES, the NQ staged a rather surprising rally around midday during Monday’s trading. The initial balance low held firm throughout the session, showing formidable support at 2820. And while a bounce from this zone was likely coming, it’s hard to say that anyone really saw how big the rip would actually become, as dovish Fed speak managed to creep its way into the fold yesterday.
The key zone of resistance, especially early on in the day will be 2865. A break above this zone could spark a decent upside move, and likely targets 2869.25, 2882.25, and 2886.75. If price fails at 2865, watch 2839.25 and 2826.75 for downside target zones.
Longer term, the major line in the sand is 2900. Even if price bounces from current levels, real strength will not enter the market until 2900 is converted by the bulls. Not only that, but price would need to surpass 2931 to begin generating positive upside momentum.
Again, like the ES, a retest of the 2900 support zone will be big for the NQ. If this level is sold on first test, we could be looking at another wave of selling back to key support between 2815 and 2818.
Here are the targets for the current session and the week ahead:
| PivotBoss ADR Targets for: E-Mini NASDAQ 100 (NQ) | |||||
| Jun 25, 2013 | |||||
| ADR (10) | ONH | ONL | AWR (10) | WH | WL |
| 51.43 | 2,865.25 | 2,830.75 | 115.00 | 2,870.75 | 2,817.75 |
| DAILY TARGETS | WEEKLY TARGETS | ||||
| BULL | BEAR | BULL | BEAR | ||
| 2,856.47 | 2,839.54 | 2,904.00 | 2,731.50 | ||
| 2,869.32 | 2,826.68 | 2,932.75 | 2,702.75 | ||
| 2,882.18 | 2,813.82 | ||||
| 2,895.04 | 2,800.96 | ||||
| *BOLD indicates primary objectives | |||||
Crude Oil
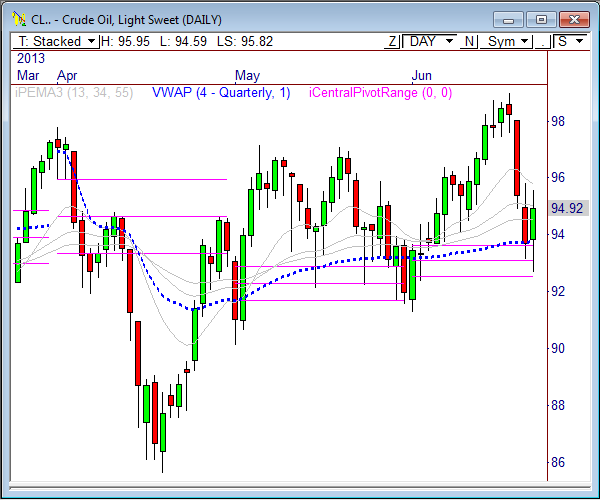
Yesterday I wrote, “A morning push into the 93.85 to 94.13 zone will likely be a key zone to sell early.” Crude Oil rallied into this zone several times early in the session, with each push being sold like clockwork. However, a midday news wire caused the price of Crude to rally big by the end of the day.
The daily chart shows Crude was defended at the monthly pivot range and quarterly VWAP, which is a support zone that spans from 92.53 to 93.75. Continue to watch this zone for longer term direction in this commodity.
While CL might rally above 96 in today’s session, there is a ton of overhead resistance up to 96.62, which could be sold on first test.
Given current overnight strength in Crude, look to buy into weakness early in the session between 94.60 and 94.89.
Here are the targets for the current session and the week ahead:
| PivotBoss ADR Targets for: Crude Oil (CL) | |||||
| Jun 25, 2013 | |||||
| ADR (10) | ONH | ONL | AWR (10) | WH | WL |
| 2.04 | 96.09 | 94.59 | 4.25 | 95.59 | 92.67 |
| DAILY TARGETS | WEEKLY TARGETS | ||||
| BULL | BEAR | BULL | BEAR | ||
| 95.61 | 95.07 | 95.86 | 89.48 | ||
| 96.12 | 94.56 | 96.92 | 88.42 | ||
| 96.63 | 94.05 | ||||
| 97.14 | 93.54 | ||||
| *BOLD indicates primary objectives | |||||
Gold
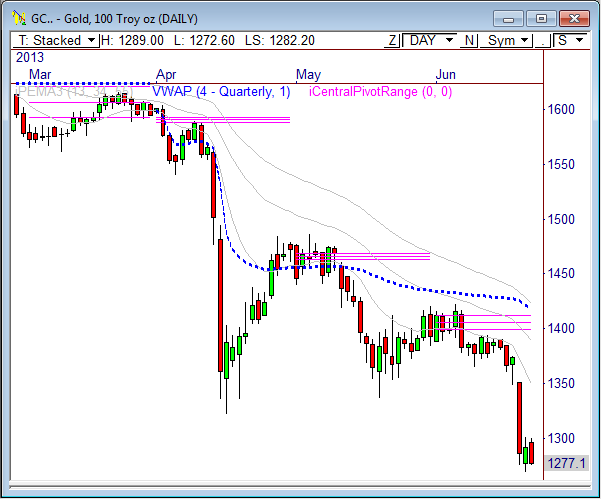
After Gold’s major technical breakdown last week, it’s currently holding at lows within a relatively small range that spans from 1270 to 1302. A breakout from this range could spark the next swing move in this commodity. As a matter of fact, Gold formed an inside day pattern after yesterday’s trading, which suggests a breakout could be on the horizon.
If Gold breaks through the top of the range, watch 1309, 1322.50, and 1335.9 for key targets above. If Gold breaks through 1270 support, however, I’ll be watching 1228.30, 1215.50, and 1202.7 as near term downside targets.
Here are the targets for the current session and the week ahead:
| PivotBoss ADR Targets for: Gold (GC) | |||||
| Jun 25, 2013 | |||||
| ADR (10) | ONH | ONL | AWR (10) | WH | WL |
| 27.88 | 1,289.00 | 1,272.60 | 66.67 | 1,300.70 | 1,275.10 |
| DAILY TARGETS | WEEKLY TARGETS | ||||
| BULL | BEAR | BULL | BEAR | ||
| 1,286.54 | 1,275.06 | 1,325.10 | 1,225.10 | ||
| 1,293.51 | 1,268.09 | 1,341.77 | 1,208.43 | ||
| 1,300.48 | 1,261.12 | ||||
| 1,307.45 | 1,254.15 | ||||
| *BOLD indicates primary objectives | |||||
Good luck and trade well.
Frank Ochoa
@PivotBoss


