E-Mini S&P 500
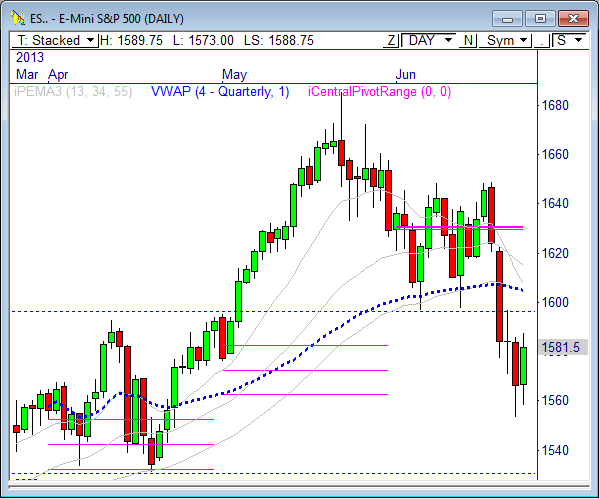
The E-Mini S&P 500 continues to march higher after forming a recent low at 1553.25, and I’ve had my sights set on a retest of the 1600 level. I mentioned before that after a steady decline like the one we’ve had since last Wednesday, there is a tendency for the market to get a reaction rally. It’s what happens after the reaction rally that gives us a better sense of upcoming direction.
The daily chart below shows the market is within striking distance of retesting the 1595 to 1600 zone of support that was broken late last week. Not only that, but there is also a confluence of resistance above that starts at 1601 and goes as high as the open gap at 1622.25.
If the market rallies into this zone and fails, we could see quite a sell-off ahead, likely back to 1530 and as low as 1513.
However, the market has been extremely resilient all year and remains a solid value after the recent pullback from the May highs. If the 1553.25 level is sealed, it wouldn’t be out of the question to see another “go” at 1650 above.
Long Term
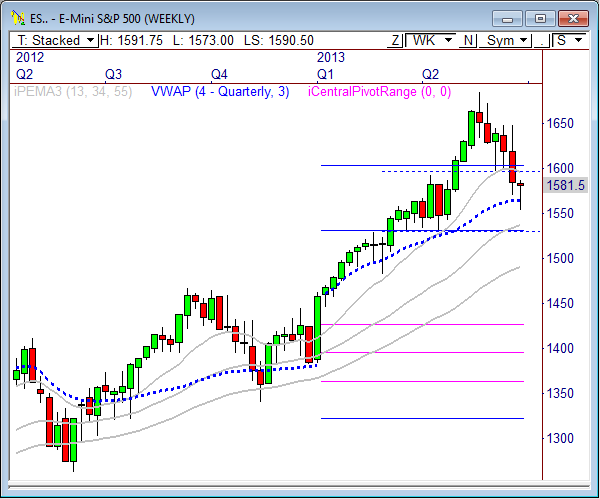
Take a look at the weekly chart below. This is the value opportunity that I mentioned above. Notice that price dropped right into the year-to-date VWAP at 1564.25 and has bounced. Additionally, price has dropped into the buy trigger zone of the stacked and sloped PEMA moving averages and also continues to hold above the yearly R1 floor pivot.
This setup is about as good as it gets for buying dips, regardless of the timeframe you are looking at. The key thing to remember here is the the current weekly bar is not yet finished developing. We have to revisit this chart after Friday’s close to see how it stacks up. But if the weekly bar continues to look like a buying tail, then we could see a solid buy opportunity next week on a longer term scale.
For Tuesday’s Market
In yesterday’s ES report I wrote, “Given that the current 10-day ADR is 28.35, a full range move would target the 1586.50 level, but watch 1579.50 as the primary bull target…Watch 1590 to 1595, as a test at this zone will likely find resistance early on, while a drop into 1565 to 1570 could find near term support.”
The ES opened the session with a gap up and began to fill the gap almost immediately, but found support at 1570 and eventually rallied the rest of the session to the 1586.50 target mentioned above, which was 5 ticks from the high of the session.
Currently, the ES has rallied sharply overnight, from a low of 1573 to a current last print of 1590.25. Given this overnight range, and the fact that we are going to open above yesterday’s price range, indicates continued strength today. Watch the bull targets below, and also keep an eye on 1601, which is the current 50% Fib level of the recent drop.
Look to buy into weakness this morning. A drop back toward 1583.50 to 1586 could open the door to a nice move higher to begin the session.
There are several key economic reports that traders will be watching today, which could influence price action:
7:30am CT: Final GDP q/q
9:30am CT: Crude Oil Inventories
Trade Update
I’m still short the ES from 1600 and still maintain a theoretical average entry of 1618.50 after scaling out of the bulk of my trade. I’m still targeting 1530, but recent strength could change that very quickly. There is a lot of resistance above and 1613 still makes a lot of sense for a swing stop. If the market heats up more than expected, I may move my stop down to 1605 during the session and look to reload on the next swing opportunity.
SHORT: 1600
Profit/Loss: +10 Points
Objective: 1530
Stop: 1613
Breakeven Point: 1618.50
Here are the targets for the current session and the week ahead:
| PivotBoss ADR Targets for: E-Mini S&P 500 (ES) | |||||
| Jun 26, 2013 | |||||
| ADR (10) | ONH | ONL | AWR (10) | WH | WL |
| 29.25 | 1,591.75 | 1,573.00 | 64.38 | 1,586.25 | 1,553.25 |
| DAILY TARGETS | WEEKLY TARGETS | ||||
| BULL | BEAR | BULL | BEAR | ||
| 1,587.63 | 1,577.13 | 1,601.54 | 1,504.97 | ||
| 1,594.94 | 1,569.81 | 1,617.63 | 1,488.87 | ||
| 1,602.25 | 1,562.50 | ||||
| 1,609.56 | 1,555.19 | ||||
| *BOLD indicates primary objectives | |||||
E-Mini NASDAQ 100
In yesterday’s NQ report I wrote, “The key zone of resistance, especially early on in the day will be 2865. A break above this zone could spark a decent upside move, and likely targets 2869.25, 2882.25, and 2886.75.”
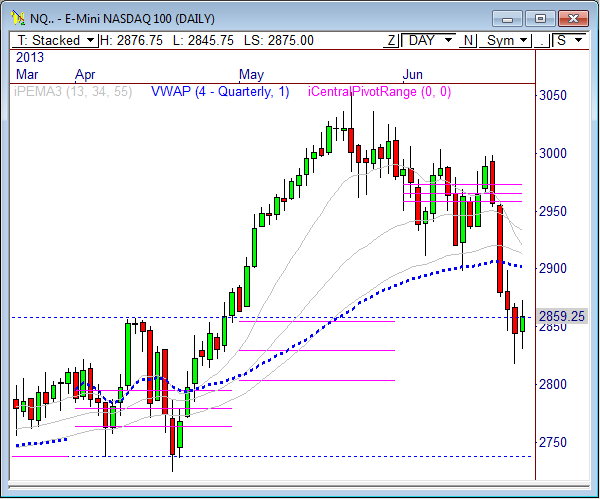
The NQ rallied in pre-market trading and took a gap up at the open of the floor session yesterday, briefly breaking the 2865 level and filling the first target of 2869.25. However, price filled the gap and proceeded to trade within the day’s initial balance (1st hour range) the entire session.
Statistically speaking, the chances of price trading within the day’s IB the entire session are somewhere around 5%, and what this rather coiled behavior tells me is that a potential breakout is on the horizon. The fact that a very narrow pivot range has developed for today’s session further indicates a breakout could be around the bend.
Another thing to keep in mind is that the NQ had a daily range of just 43 points yesterday, when the current average daily range over the last 10 sessions has been 51.75. Price is ready to break out, and is currently trading above yesterday’s price range, so keep an eye on the daily bull targets noted below: 2884.50, 2897.50, and 2910.50.
If price cannot hold 2,870, look for a push to 2860 and 2852.
Here are the targets for the current session and the week ahead:
| PivotBoss ADR Targets for: E-Mini NASDAQ 100 (NQ) | |||||
| Jun 26, 2013 | |||||
| ADR (10) | ONH | ONL | AWR (10) | WH | WL |
| 51.75 | 2,878.00 | 2,845.75 | 123.75 | 2,870.75 | 2,817.75 |
| DAILY TARGETS | WEEKLY TARGETS | ||||
| BULL | BEAR | BULL | BEAR | ||
| 2,871.63 | 2,852.13 | 2,910.56 | 2,724.94 | ||
| 2,884.56 | 2,839.19 | 2,941.50 | 2,694.00 | ||
| 2,897.50 | 2,826.25 | ||||
| 2,910.44 | 2,813.31 | ||||
| *BOLD indicates primary objectives | |||||
Crude Oil
In yesterday’s Crude report I wrote, “Given current overnight strength in Crude, look to buy into weakness early in the session between 94.60 and 94.89.”
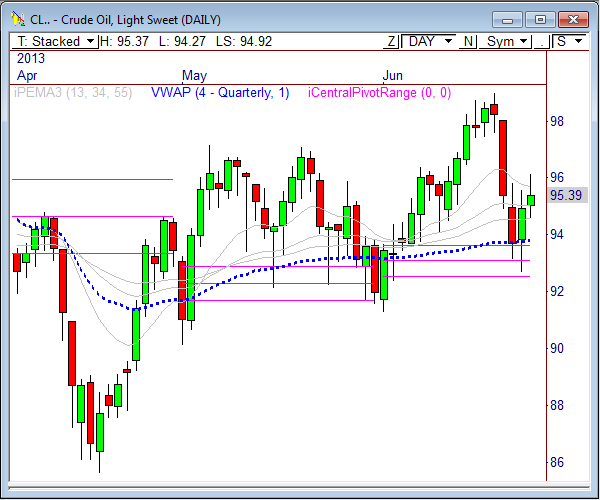
Crude Oil rallied into yesterday’s open, but the gap up was immediately sold on the opening print of the floor session, which led to a steady decline the first 90 minutes of the session. Crude eventually dropped into my buy zone mentioned above and rallied 1.15 points from the day’s low of 94.72. At $1000 per point, that move was worth $1,150 per contract traded, which is a 45% gain on margin.
I also mentioned yesterday that Crude was likely to find resistance above the 96 level, all the way up to 96.62. As it turns out, price rallied to 96.17 before settling at 95.32 on the day. The monthly R1 floor pivot is 96.05 and price is potentially putting in a lower high at that level, which could lead to another wave of weakness.
Also, keep in mind that Crude has already rallied from the lows of the week to our weekly bull target of 96.11, which is our primary weekly target for the week (seen below).
The 5-minute chart shows that Crude has formed a very narrow pivot range for today’s upcoming session, which means we could see some breakout/trending behavior. If so, look to play to the daily bull or bear targets noted below..
Here are the targets for the current session and the week ahead:
| PivotBoss ADR Targets for: Crude Oil (CL) | |||||
| Jun 26, 2013 | |||||
| ADR (10) | ONH | ONL | AWR (10) | WH | WL |
| 2.01 | 95.37 | 94.27 | 4.58 | 95.59 | 92.67 |
| DAILY TARGETS | WEEKLY TARGETS | ||||
| BULL | BEAR | BULL | BEAR | ||
| 95.28 | 94.37 | 96.11 | 89.24 | ||
| 95.78 | 93.86 | 97.25 | 88.09 | ||
| 96.28 | 93.36 | ||||
| 96.78 | 92.86 | ||||
| *BOLD indicates primary objectives | |||||
Gold
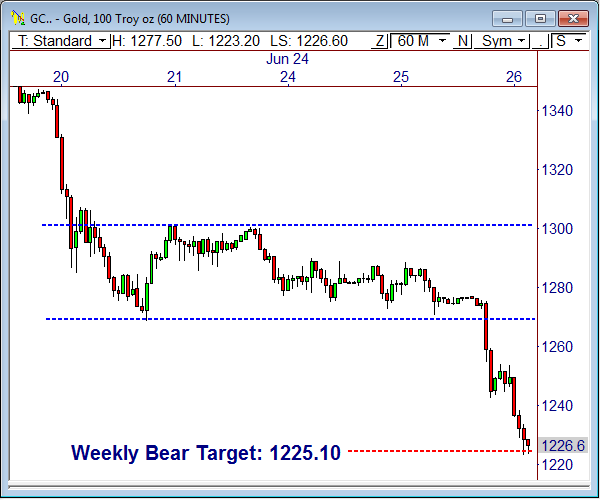
In yesterday’s Gold report I wrote, “Gold formed an inside day pattern after yesterday’s trading, which suggests a breakout could be on the horizon…If Gold breaks through 1270 support, however, I’ll be watching 1228.30, 1215.50, and 1202.7 as near term downside targets.”
Gold traded rather quietly throughout much of yesterday’s session, but eventually broke through the 1270 support level at 8pm CT last night, unleashing a huge wave of selling that led price right down to the 1228.30 target mentioned above, in addition to the 1225.10 weekly target posted in the ADR levels below.
What’s a move like that worth? At $100 per point, that drop of 44.90 points in Gold amounts to $4490 per contract traded. With a margin rate of $5600 per contract, that’s an 80% gain.
I think there’s more downside left in this move. Now that the primary weekly bear target has been reached, we look to the next downside target, which is currently 1203.60. As long as price remains below 1270, the idea will be to sell into rallies, especially if price rallies into 1238.70 to 1242.60.
Here are the targets for the current session and the week ahead:
| PivotBoss ADR Targets for: Gold (GC) | |||||
| Jun 26, 2013 | |||||
| ADR (10) | ONH | ONL | AWR (10) | WH | WL |
| 27.40 | 1,277.50 | 1,223.20 | 71.50 | 1,300.70 | 1,275.10 |
| DAILY TARGETS | WEEKLY TARGETS | ||||
| BULL | BEAR | BULL | BEAR | ||
| 1,236.90 | 1,263.80 | 1,328.73 | 1,221.48 | ||
| 1,243.75 | 1,256.95 | 1,346.60 | 1,203.60 | ||
| 1,250.60 | 1,250.10 | ||||
| 1,257.45 | 1,243.25 | ||||
| *BOLD indicates primary objectives | |||||
Good luck and trade well.
Frank Ochoa
@PivotBoss

