E-Mini S&P 500
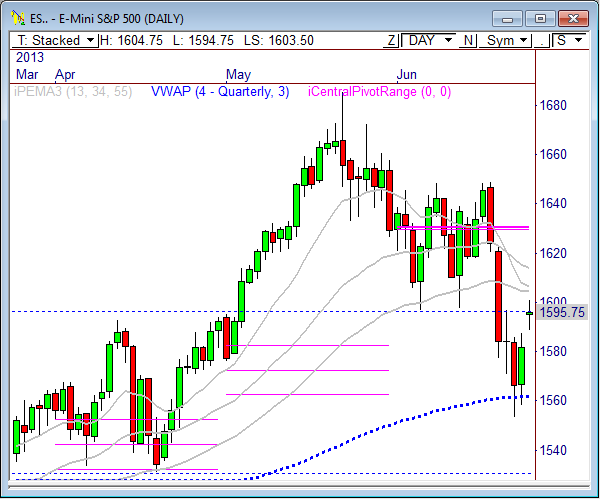
As expected, the E-Mini S&P 500 finally made a run for our 1601 target Wednesday and put in a high on the day of 1601.25, which was hit with immediate selling on first touch. However, the market remained strong into the close, and continues to remains strong in overnight and pre-market trading. As a matter of fact, price just put in a new high on the day at 1604.75 and looks poised to test the 1608.50 level above.
Remember, the spoos is currently testing a major area of significance in the charts. The 1600 to 1609 zone is important to both bulls and bears, and volatility in this area is likely to increase. If price rallies into 1609 and fails, another big wave of weakness could be seen down to 1513. As a matter of fact, I’m beginning to see a sentiment shift among pro traders that are looking to sell into this strength, which is a far departure from the “buy every dip” mentality that we’ve seen for months.
The weekly chart still looks very strong, however. The reversal tail in the weekly is still developing, but if price can maintain any semblance of gains this week, we could see quite the buying opportunity next week. Of course, we’ve still got two days left in the week, month, and quarter, so there’s still plenty of time to see how price will respond.
For Tuesday’s Market
In yesterday’s ES report I wrote, “Look to buy into weakness this morning. A drop back toward 1583.50 to 1586 could open the door to a nice move higher to begin the session…Watch the bull targets below, and also keep an eye on 1601.”
The ES opened the session with a gap up and began to fill the gap before finding support at 1588.50, which was 2.5 points above our buy zone. The idea to buy into weakness was right on, and price eventually rallied to our 1601 target by the end of the day.
The ES held yesterday’s gains throughout the overnight and pre-market trading and looks poised to test 1608.50 above, with a shot to reach 1612.75, which is the major 62% Fib level of the recent drop.
We will be opening with another gap up, and will likely see some degree of filling. However, likely yesterday, look to buy into weakness somewhere between 1595 and 1596.25. Price is likely to remain bullish so long as 1588 continues to hold.
There are several key economic reports that traders will be watching today, which could influence price action:
7:30am CT: Unemployment Claims
9:00am CT: Pending Home Sales m/m
10:00am CT: FOMC Member Dudley speaks
10:30am CT: FOMC Member Powell speaks
10:30am CT: Natural Gas Storage
Trade Update
I’m still short the ES from 1600 and still maintain a theoretical average entry of 1618.50 after scaling out of the bulk of my trade and currently have a gain of 15+ points. The 1608.50 to 1609 level will be extremely important today. Fail and the position is likely safe. Push higher and we could see a blow off move that takes out final stops. Either way, I go home with a profitable trade.
SHORT: 1600
Profit/Loss: +15 Points
Objective: 1530
Stop: 1613
Breakeven Point: 1618.50
Here are the targets for the current session and the week ahead:
| PivotBoss ADR Targets for: E-Mini S&P 500 (ES) | |||||
| Jun 27, 2013 | |||||
| ADR (10) | ONH | ONL | AWR (10) | WH | WL |
| 27.50 | 1,604.00 | 1,594.75 | 66.25 | 1,601.25 | 1,553.25 |
| DAILY TARGETS | WEEKLY TARGETS | ||||
| BULL | BEAR | BULL | BEAR | ||
| 1,608.50 | 1,590.25 | 1,602.94 | 1,551.56 | ||
| 1,615.38 | 1,583.38 | 1,619.50 | 1,535.00 | ||
| 1,622.25 | 1,576.50 | ||||
| 1,629.13 | 1,569.63 | ||||
| *BOLD indicates primary objectives | |||||
E-Mini NASDAQ 100
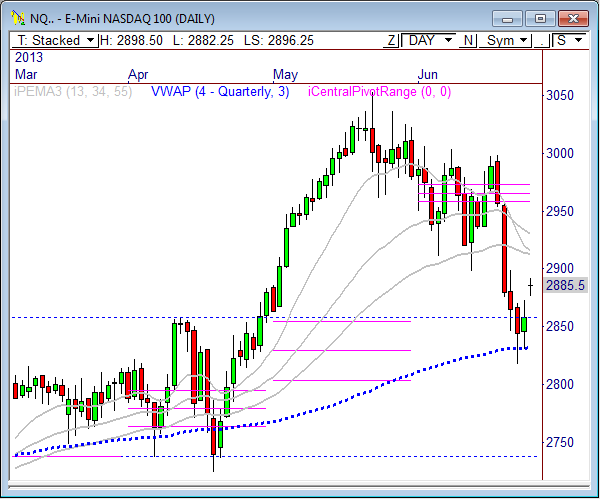
In yesterday’s NQ report I wrote, “Price is ready to break out, and is currently trading above yesterday’s price range, so keep an eye on the daily bull targets noted below: 2884.50, 2897.50, and 2910.50.”
The NQ opened Wednesday’s session with pre-market strength that manifested itself into a large gap up at the open of the pit trading. Price then traded quietly the rest of the day, but was able to maintain gains after the gap closed the day just above 2885.
As it turns out, 2885.75 is the 38% Fib level, as measured from last week’s 2999 high to this week’s 2817.75 low. This zone can oftentimes introduce selling pressure, but the fact that price has held these levels during overnight and pre-market trading indicates more upside is likely, so watch for a potential test above at the 50% level of 2908.25.
Between 2908.25 and 2931 is where it gets interesting, as this may be the zone where the bears start to hunt for swing shorts again. As long as price continues to be defended at 2875, more upside is likely to be seen. But a break of this level could open the gates to the downside.
Here are the targets for the current session and the week ahead:
| PivotBoss ADR Targets for: E-Mini NASDAQ 100 (NQ) | |||||
| Jun 27, 2013 | |||||
| ADR (10) | ONH | ONL | AWR (10) | WH | WL |
| 47.50 | 2,897.00 | 2,882.25 | 128.25 | 2,894.50 | 2,817.75 |
| DAILY TARGETS | WEEKLY TARGETS | ||||
| BULL | BEAR | BULL | BEAR | ||
| 2,906.00 | 2,873.25 | 2,913.94 | 2,798.31 | ||
| 2,917.88 | 2,861.38 | 2,946.00 | 2,766.25 | ||
| 2,929.75 | 2,849.50 | ||||
| 2,941.63 | 2,837.63 | ||||
| *BOLD indicates primary objectives | |||||
Crude Oil
In yesterday’s Crude report I wrote, “The 5-minute chart shows that Crude has formed a very narrow pivot range for today’s upcoming session, which means we could see some breakout/trending behavior. If so, look to play to the daily bull or bear targets noted below..”
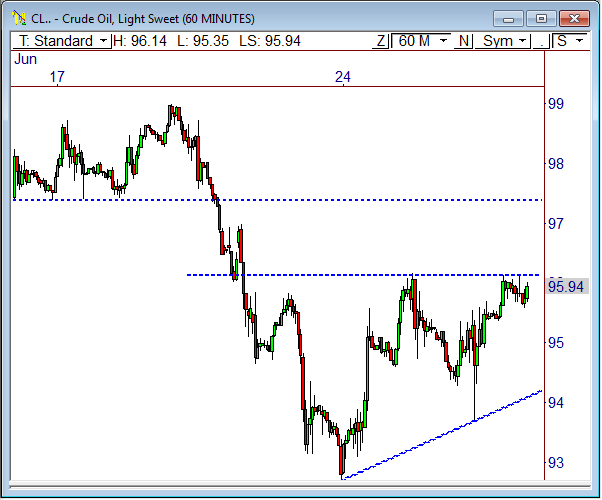
Crude Oil traded quietly early in the session, but that all changed once the Crude Oil inventories report came out, as light sweet got a major downside break from a tightly coiled range and dropped right into our primary bear target for the day at 93.86. Crude put in a low of 93.68 on the day and rallied back to 95.60 before settling at 95.50, capping off a wild session.
Crude Oil is now sitting just beneath major price resistance at 96, which also coincides with the monthly R1 pivot at 96.05. As a matter of fact, The 96 level has been in play for several weeks and could pave the path to the next major move in this commodity.
An upside push break and hold beyond the 96 level introduces 96.35, 96.85 and 97.35 above, with a shot at prior highs at 99.01 in the coming days. A failure at 96 leads to a likely test of the bear targets noted below, primarily 95.14 and 94.64.
Here are the targets for the current session and the week ahead:
| PivotBoss ADR Targets for: Crude Oil (CL) | |||||
| Jun 27, 2013 | |||||
| ADR (10) | ONH | ONL | AWR (10) | WH | WL |
| 2.00 | 96.14 | 95.35 | 4.84 | 96.17 | 92.67 |
| DAILY TARGETS | WEEKLY TARGETS | ||||
| BULL | BEAR | BULL | BEAR | ||
| 96.35 | 95.14 | 96.30 | 92.54 | ||
| 96.85 | 94.64 | 97.51 | 91.33 | ||
| 97.35 | 94.14 | ||||
| 97.85 | 93.64 | ||||
| *BOLD indicates primary objectives | |||||
Gold
In yesterday’s Gold report I wrote, “As long as price remains below 1270, the idea will be to sell into rallies, especially if price rallies into 1238.70 to 1242.60.”
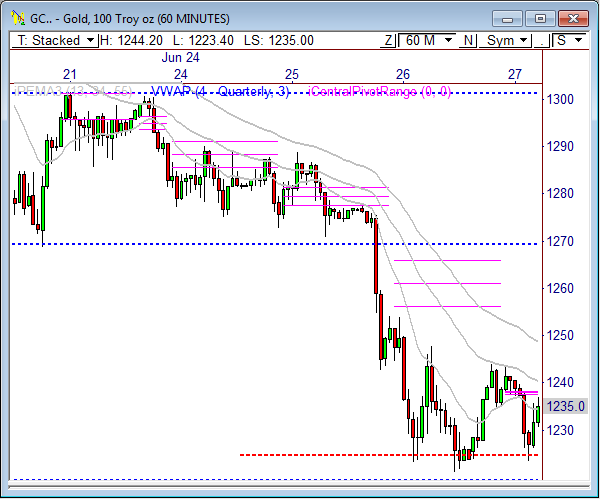
The idea to sell Gold rallies was spot on. Gold pushed higher from the 1222 zone of support and rallied right into the 1247 level before seeing sellers pile on. Selling the rally into 1247 was worth over 20 points back to 1222 support, and each rally into 1240 to 1245 led to similar results.
Gold is currently sitting on the 1222 support zone, developing a trading range from 1220 to 1250. Trading ranges that develop at lows during a bear trend usually break to the downside. However, a breakout in either direction will likely provide a nice short term burst of movement.
A break through 1220 support introduces 1207.50 and 1192.60. However, keep in mind, the full weekly bear target of 1222.80 has already been reached, which means Gold has already moved in 3 days what it usually averages in a week of trading. Therefore, Gold may be short term oversold If 1220 continues to hold as support, we could see another rally to 1240 to 1245 during the session. If price breaks through 1250, we may see a test at 1270 above.
Here are the targets for the current session and the week ahead:
| PivotBoss ADR Targets for: Gold (GC) | |||||
| Jun 27, 2013 | |||||
| ADR (10) | ONH | ONL | AWR (10) | WH | WL |
| 27.2 | 1,244.20 | 1,223.80 | 77.90 | 1,300.70 | 1,223.50 |
| DAILY TARGETS | WEEKLY TARGETS | ||||
| BULL | BEAR | BULL | BEAR | ||
| 1,237.40 | 1,230.60 | 1,281.93 | 1,242.28 | ||
| 1,244.20 | 1,223.80 | 1,301.40 | 1,222.80 | ||
| 1,251.00 | 1,217.00 | ||||
| 1,257.80 | 1,210.20 | ||||
| *BOLD indicates primary objectives | |||||
Good luck and trade well.
Frank Ochoa
@PivotBoss


