E-Mini S&P 500
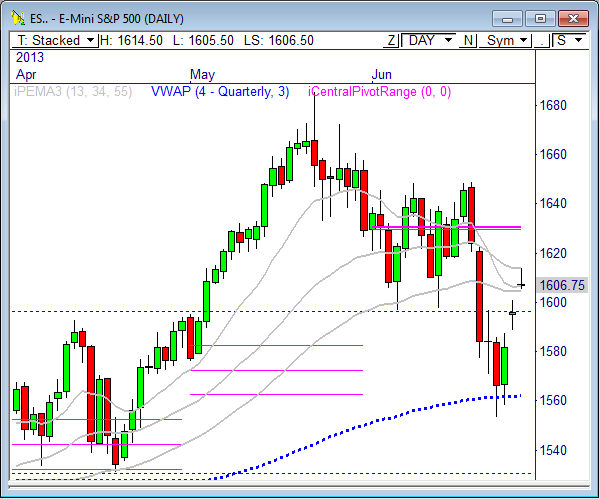
The E-Mini S&P 500 pushed into the 1612.75 level that we mentioned in yesterday’s report, and eventually topped out at 1614.25 before finding some selling. As a matter of fact, yesterday’s high price matches the 34-period PEMA moving average from the daily timeframe, which could lead to short term selling, with downside targets at 1591.50 and 1583.75.
It’s what happens at 1583.75 to 1576.25 that could decide whether we push higher, or retest the 1553.25 lows from earlier in the week. Of course, this test will happen sometime next week. And with holiday trading volume likely to be in full effect today and into next week, it could make for a very slow few days of trading.
Longer term, the ES remains very bullish. The weekly chart continues to show strength off the recent lows, which could lead to another longer term wave of strength. Buying begets buying, but heading into the heart of the summer trading months could slow that process down a bit.
For Today’s Market
In yesterday’s ES report I wrote, “The ES held yesterday’s gains throughout the overnight and pre-market trading and looks poised to test 1608.50 above, with a shot to reach 1612.75”
The ES opened the session with another gap up, but maintained gap support throughout the session, forming a tight range that it held into the close. Price tested the 1608.50 and 1612.75 zones and topped out at 1614.25 before ending the day at 1606.75.
The ES remains within a steep bull trend since bottoming out Monday at 1553.25. However, the ES has formed a narrow pivot range and a tight trading range that could offer breakout potential in either direction. Watch 1615 for strength, with bull targets at 1623.75 and 1629.75. Also watch 1605 for weakness, with targets at 1602.50 and 1596.25.
Watch these key economic reports for today’s price action:
8:45am CT: Chicago PMI
8:55am CT: Revised UoM Consumer Sentiment
Trade Update
I covered my trade upon a break through 1613, netting 5+ points on the swing short opportunity. The trade came within 23 points of bagging a 70-point winner in a matter of a few days. The best part about the trade is that I virtually eliminated all the risk in the trade by the end of the first day in trade. Any time you can give yourself a free trade to play to a target, you’ve done well. I’ll saddle up and look to play the next key swing.
COVERED: 1613.50
Profit/Loss: +5 Points
Here are the targets for the current session and the week ahead:
| PivotBoss ADR Targets for: E-Mini S&P 500 (ES) | |||||
| Jun 28, 2013 | |||||
| ADR (10) | ONH | ONL | AWR (10) | WH | WL |
| 24.25 | 1,614.50 | 1,605.50 | 67.25 | 1,614.50 | 1,553.25 |
| DAILY TARGETS | WEEKLY TARGETS | ||||
| BULL | BEAR | BULL | BEAR | ||
| 1,617.63 | 1,602.38 | 1,603.69 | 1,564.06 | ||
| 1,623.69 | 1,596.31 | 1,620.50 | 1,547.25 | ||
| 1,629.75 | 1,590.25 | ||||
| 1,635.81 | 1,584.19 | ||||
| *BOLD indicates primary objectives | |||||
E-Mini NASDAQ 100
In yesterday’s NQ report I wrote, “the fact that price has held these levels during overnight and pre-market trading indicates more upside is likely, so watch for a potential test above at the 50% level of 2908.25.”
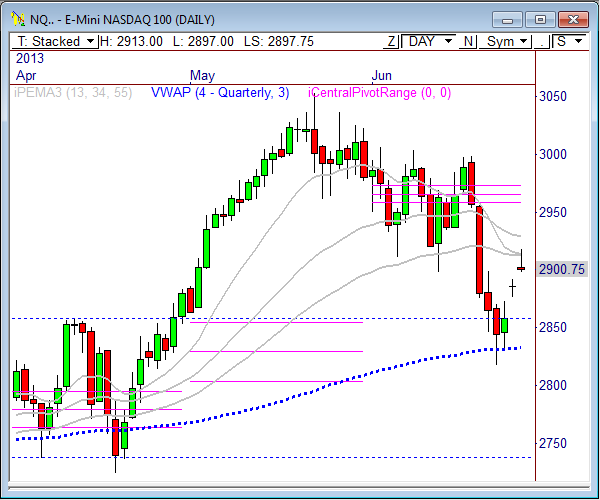
The NQ opened the session with strength yesterday and rallied right into the 2908.25 level before topping out at 2918.25 on the session, just 2 ticks past our primary bull target of 2917.75 noted in Thursday’s ADR targets table.
The daily chart now shows the NQ is testing a very thick zone of resistance between 2908.25 and 2931, which offers both PEMA moving average resistance and macro Fib confluence. The daily bar shows a selling tail developed after Thursday’s session, which could be a precursor to weakness ahead. As long as price remains below 2931, we could begin to see the tides turn downward again – at least short term.
The weekly chart continues to look strong off YTD VWAP. If the NQ finishes the week strong or holding, then we could see more buyers enter the market.
Short term, watch 2920 for strength, with bull targets at 2929.50 and 2940. Watch 2897.75 for weakness with daily bear targets at 2881.25 and 2870.75.
Here are the targets for the current session and the week ahead:
| PivotBoss ADR Targets for: E-Mini NASDAQ 100 (NQ) | |||||
| Jun 28, 2013 | |||||
| ADR (10) | ONH | ONL | AWR (10) | WH | WL |
| 42.25 | 2,913.00 | 2,897.75 | 127.50 | 2,918.25 | 2,817.75 |
| DAILY TARGETS | WEEKLY TARGETS | ||||
| BULL | BEAR | BULL | BEAR | ||
| 2,918.88 | 2,891.88 | 2,913.38 | 2,822.63 | ||
| 2,929.44 | 2,881.31 | 2,945.25 | 2,790.75 | ||
| 2,940.00 | 2,870.75 | ||||
| 2,950.56 | 2,860.19 | ||||
| *BOLD indicates primary objectives | |||||
Crude Oil
In yesterday’s Crude report I wrote, “Crude Oil is now sitting just beneath major price resistance at 96, which also coincides with the monthly R1 pivot at 96.05. As a matter of fact, The 96 level has been in play for several weeks and could pave the path to the next major move in this commodity…An upside push break and hold beyond the 96 level introduces 96.35, 96.85 and 97.35 above.”
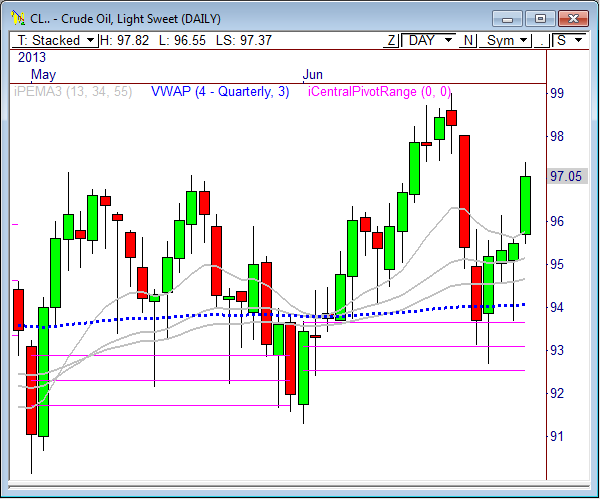
Crude Oil opened the session with a clean 30-minute opening range breakout through 96.25 and rallied to each of the targets noted above, hitting the final target at 97.35, which was just 6 ticks from the high of the session and capping a move worth $1,100 per contract in just 90 minutes. Great move off a great level.
The daily chart shows Crude got the bounce off the monthly pivot range between 92.51 and 93.63, which I talked about earlier this week. The fact that Crude got the break through 96 indicates a likely test at prior highs at 99.01. Look to buy into weakness as long as Crude stays above 97.00. A break below 97 indicates a likely test back at 96.25.
The primary bull target to watch today is 98.06, and primary bear target is 96.31. Keep in mind, since Crude had a wide price range in Thursday’s market, we could see a smaller range of movement today, so also watch 97.56 as a short term bull target, and 96.82 as the short term bear target.
Here are the targets for the current session and the week ahead:
| PivotBoss ADR Targets for: Crude Oil (CL) | |||||
| Jun 28, 2013 | |||||
| ADR (10) | ONH | ONL | AWR (10) | WH | WL |
| 2.01 | 97.82 | 96.55 | 5.00 | 97.82 | 92.67 |
| DAILY TARGETS | WEEKLY TARGETS | ||||
| BULL | BEAR | BULL | BEAR | ||
| 97.56 | 96.82 | 96.42 | 94.07 | ||
| 98.06 | 96.31 | 97.67 | 92.82 | ||
| 98.56 | 95.81 | ||||
| 99.06 | 95.31 | ||||
| *BOLD indicates primary objectives | |||||
Gold
In yesterday’s Gold report I wrote, “Gold is currently sitting on the 1222 support zone, developing a trading range from 1220 to 1250. Trading ranges that develop at lows during a bear trend usually break to the downside…A break through 1220 support introduces 1207.50 and 1192.60.”
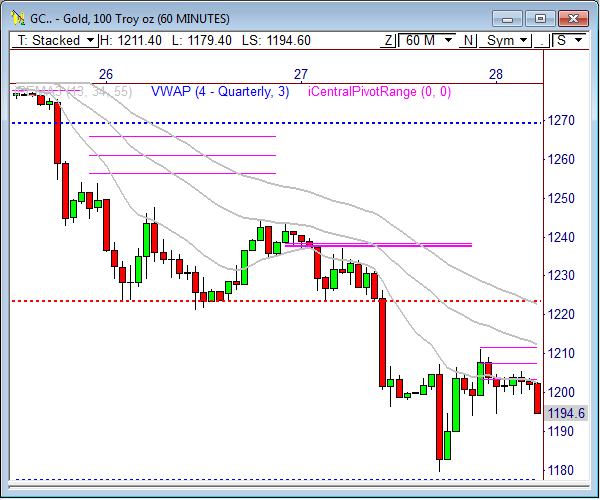
Gold opened Thursday’s market with quiet range trading for the first several hours of the day. However, a downside break eventually occurred through our 1,220 level, which sparked a steady move to both of our bear targets and more. The first target at 1207.50 was hit almost immediately, while the 1192.60 target was hit hours later. The total move captured 27.4 points, which amounts to $2,740 per contract traded. If you’re not a futures trader, the same move can be traded using a gold ETF like GLD.
Even after hitting our downside targets, Gold continued its downward push and eventually bottomed out at 1179.40, which is near the 50% Fib extension target of 1181.10 and where buyers have responded. Clearly, Gold continues to remain in a highly bearish trend. Every rally should be SOLD. Any retest of the prior support zone of 1220 to 1225 will likely be a selling opportunity, with new downside swing targets at 1155.10 and 1147.40.
By the way, watch 1147.40 very closely, as this level has some high level Fib confluence, so buyers could become very eager in this zone.
If price breaks back above 1225, we could see a brief relief rally back toward 1245. However, stay on the side of the current bear trend. Watch 1200.50 and 1190.30 as the primary bull and bear targets for the day, respectively.
Here are the targets for the current session and the week ahead:
| PivotBoss ADR Targets for: Gold (GC) | |||||
| Jun 28, 2013 | |||||
| ADR (10) | ONH | ONL | AWR (10) | WH | WL |
| 28.1 | 1,211.40 | 1,179.40 | 82.10 | 1,300.70 | 1,179.40 |
| DAILY TARGETS | WEEKLY TARGETS | ||||
| BULL | BEAR | BULL | BEAR | ||
| 1,193.45 | 1,197.35 | 1,240.98 | 1,239.13 | ||
| 1,200.48 | 1,190.33 | 1,261.50 | 1,218.60 | ||
| 1,207.50 | 1,183.30 | ||||
| 1,214.53 | 1,176.28 | ||||
| *BOLD indicates primary objectives | |||||
Good luck and trade well.
Frank Ochoa
@PivotBoss


Frank, you really do a nice job explaining exactly what you see in the charts in an easy and understandable manner. Your approach is clear and to the point. The best part: the daily and weekly targets you provide in your analysis.
Armando