PB View
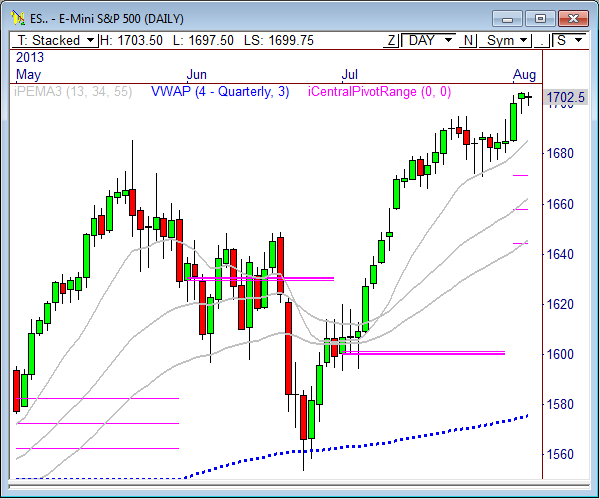
The S&P 500 futures have formed an extremely tight range over the last several sessions, and the time is coming for a breakout. There are clear lines in the sand across for of the instruments below, and none more clear than the 1695 level in the ES, which is as clear a bull/bear line as I’ve seen in weeks.
While the market is currently in full-on summer trading mode, a breakout from the current ranges could spark some decent trending movement for a few days, so continue to watch the range closely.
While there are a few items on the economic calendar, the one to watch is FOMC Member Evans speaking at Noon CT, which could provide some unexpected volatility to the market, or pass without a blip on the radar screen.
Cheers!
Frank Ochoa
PivotBoss | Own the Market
Follow me on Twitter: @PivotBoss
______________________________________________________
This daily report is currently free and open to the public, as I gather feedback and ideas ahead of a formal subscription offering later in the summer. If you have any feedback regarding anything in the report (good or bad) please provide it below in the comments section. Your comments will definitely help shape the report for the better. Thank you!
E-Mini S&P 500
The E-Mini S&P 500 futures are holding within a very tightly-coiled range that spans from 1696 to 1705. This range has formed at all-time highs over the last four sessions, but could be due for a breakout soon. The current trend is extremely bullish across all timeframes, which means regardless of which way price breaks from the range, buyers will likely become very active.
An upside break through the top of the range at 1705 forecasts a move toward 1720, while a downside break hints at a move to 1680.
The 1695 level continues to be a major dividing line between bulls and bears in the short term. Watch this level very closely for directional cues ahead.
We current overnight low of 1697.50 forecasts the day’s upside targets as 1704, 1707.50, and 1710.75. The current overnight high of 1703.50 suggests bear targets at 1693.50 and 1690.25.
Today’s scheduled economic news:
7:30am CT Trade Balance
9:00am CT JOLTS Job Openings
9:00am CT IBD/TIPP Economic Optimism
12:00pm CT FOMC Member Evans Speaks
Here are the Key Levels and Targets for the current session:
| PivotBoss Levels & Targets: E-Mini S&P 500 (ESU3) | |||||
| Tue, Aug 6, 2013 | |||||
| KEY LEVELS | ADR TARGETS | ||||
| 1,722.50 | Monthly R1 | ADR (10) | ONH | ONL | |
| 1,713.00 | Monthly H3 | 13.25 | 1,703.50 | 1,697.50 | |
| 1,707.50 | Fib Ext | AWR (10) | WH | WL | |
| 1,705.00 | PD High | 26.50 | 1,705.00 | 1,697.50 | |
| 1,702.50 | SETTLE | ||||
| 1,702.50 | VPOC | DAILY TARGETS | WEEKLY TARGETS | ||
| 1,698.75 | PD Low | BULL | BEAR | BULL | BEAR |
| 1,695.75 | LVN | 1,714.06 | 1,696.88 | 1,724.00 | 1,685.13 |
| 1,695.25 | Monthly VAH | 1,710.75 | 1,693.56 | 1,717.38 | 1,678.50 |
| 1,694.25 | LVN | 1,707.44 | 1,690.25 | ||
| 1,692.25 | Fib Ext | 1,704.13 | 1,686.94 | ||
| 1,686.75 | nVPOC | *BOLD indicates primary objectives | |||
| 1,685.50 | 13PEMA | ||||
| 1,685.00 | Open Gap | ||||
| 1,683.50 | cVPOC | ||||
| 1,677.50 | HVN | ||||
| 1,673.00 | LVN | ||||
E-Mini NASDAQ 100
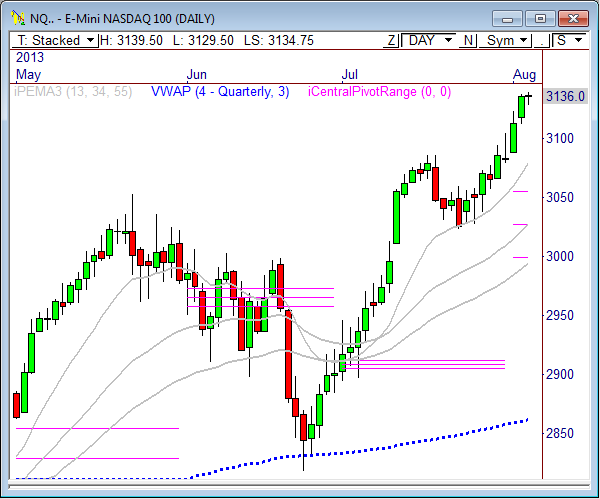
The E-Mini NASDAQ 100 futures are trading within a very tight 3-day range at recent highs, which spans from 3128 to 3140. A breakout from this range could spark the next short term directional move, so watch the boundaries closely.
The 60-minute chart shows price continues to hold within a highly bullish trend. While a downside break from the 3-day range will lead to weakness, any selling could be a higher timeframe buying opportunity within the existing bull trend, so keep this in mind.
There is a nice zone of confluence between 3122.50 and 3123.75 that could find support. There’s nothing below this range, however, until a LVN comes into view at 3113.50.
The current overnight low of 3129.50 projects upside targets at 3143.50 and 3150.50, while the overnight high of 3139.50 forecasts bear targets of 3125.50 and 3118.50.
Here are the targets for the current session and the week ahead:
| PivotBoss Levels & Targets: E-Mini NASDAQ 100 (NQU3) | |||||
| Tue, Aug 6, 2013 | |||||
| KEY LEVELS | ADR TARGETS | ||||
| 3,160.50 | Monthly R1 | ADR (10) | ONH | ONL | |
| 3,145.00 | Fib Ext | 28 | 3,139.50 | 3,129.50 | |
| 3,141.00 | Monthly H3 | AWR (10) | WH | WL | |
| 3,140.25 | PD High | 63.75 | 3,140.25 | 3,128.00 | |
| 3,137.50 | SETTLE | ||||
| 3,134.00 | VPOC | DAILY TARGETS | WEEKLY TARGETS | ||
| 3,134.00 | PD MP | BULL | BEAR | BULL | BEAR |
| 3,128.00 | PD Low | 3,164.50 | 3,125.50 | 3,191.75 | 3,092.44 |
| 3,123.75 | LVN | 3,157.50 | 3,118.50 | 3,175.81 | 3,076.50 |
| 3,123.50 | Fib Ext | 3,150.50 | 3,111.50 | ||
| 3,122.50 | nVPOC | 3,143.50 | 3,104.50 | ||
| 3,113.50 | LVN | *BOLD indicates primary objectives | |||
| 3,110.00 | nVPOC | ||||
| 3,110.00 | HVN | ||||
| 3,106.50 | LVN | ||||
| 3,092.75 | HVN | ||||
| 3,092.50 | Open Gap | ||||
Crude Oil
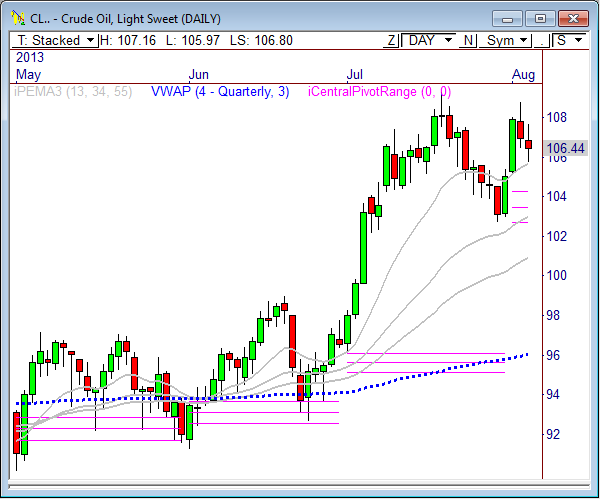
Early in Monday’s market, Crude Oil dropped right into a great area of support at 105.75, which offered a confluence of levels. First, this level was the exact 50% Fib level from last week’s range, which spans from 102.67 to 108.82. This level is also a major LVN and was the low of the 15-minute opening range. So when price tested this zone, it was quickly bought up, which sent price rallying to 107 within a couple of hours.
I bought Crude Oil at 105.75 and sold half the trade at 106.69, getting an actual fill of 106.66 for a gain of .91. I continue to hold the second half of the trade from 105.75 and I’m allowing it to run as far as it can, because I believe it has the potential to hit new highs within the current upmove.
If 105.75 continues to hold, I’m looking for price to rally back toward prior highs at 108.80, with a shot to reach 110 and 111.85. The yearly R1 Floor Pivot is 110, and the ABC measured move from 102.67 to 108.82 forecasts a target of 111.85. A break and hold of 105.75 kills this theory.
The current overnight low of 105.97 forecasts bull targets at 107.58 and 108.12, while the overnight high of 107.27 suggests 106.20 and 105.66.
Here are the targets for the current session and the week ahead:
| PivotBoss Levels & Targets: Crude Oil (CLU3) | |||||
| Tue, Aug 6, 2013 | |||||
| KEY LEVELS | ADR TARGETS | ||||
| 110.00 | Yearly R1 | ADR (10) | ONH | ONL | |
| 108.48 | LVN | 2.15 | 107.27 | 105.97 | |
| 108.00 | LVN | AWR (10) | WH | WL | |
| 107.61 | Fib Ext | 4.54 | 107.69 | 105.70 | |
| 107.59 | nVPOC | ||||
| 107.35 | LVN | DAILY TARGETS | WEEKLY TARGETS | ||
| 107.08 | PD High | BULL | BEAR | BULL | BEAR |
| 107.03 | LVN | 108.66 | 106.20 | 110.24 | 104.29 |
| 106.83 | VPOC | 108.12 | 105.66 | 109.11 | 103.15 |
| 106.56 | SETTLE | 107.58 | 105.12 | ||
| 106.23 | LVN | 107.05 | 104.58 | ||
| 105.88 | cVPOC | *BOLD indicates primary objectives | |||
| 105.52 | nVPOC | ||||
| 105.18 | Fib Ext | ||||
| 105.05 | Open Gap | ||||
| 104.86 | HVN | ||||
| 104.59 | nVPOC | ||||
| 104.00 | LVN | ||||
Gold
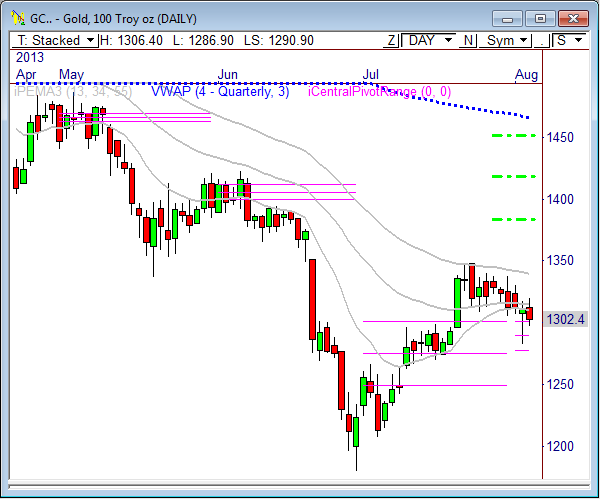
Gold has had a bearish start to the week, but continues to look bullish in the daily timeframe. As I wrote last Friday, Gold has the potential to rally toward targets of 1383.7 and 1417.5 by the end of the month.
Basically, Friday’s morning dip into the monthly pivot range was bought big time, leaving a bullish reversal candlestick in the process. The fact that Gold has formed a monthly Inside Value pivot range relationship indicates we could see a breakout month in August. If Friday’s low continues to hold, we could see Gold slingshot higher toward the first monthly target of 1383.7. This is still a big IF.
Either way, I’ve bought December Gold at 1300.2 and will be holding the trade as a swing/position trade, with a stop below Friday’s low and a target range of 1383.7 to 1417.5.
In pre-market trading, Gold is holding within a very tight range from 1287 to 1296 after selling off from 1306 last night. This range will likely dictate the day’s early direction move, so watch the boundaries closely. An upside push through 1296 forecasts targets at 1300.1 and 1306.6, while a downside push through 1287 suggests a target of 1280.1.
Here are the targets for the current session and the week ahead:
| PivotBoss Levels & Targets: Gold (GCQ3) | |||||
| Tue, Aug 6, 2013 | |||||
| KEY LEVELS | ADR TARGETS | ||||
| 1,420.20 | LVN | ADR (10) | ONH | ONL | |
| 1,390.60 | HVN | 26.3 | 1,306.40 | 1,286.90 | |
| 1,371.70 | Monthly R1 | AWR (10) | WH | WL | |
| 1,351.40 | Monthly H3 | 55.30 | 1,320.30 | 1,286.90 | |
| 1,348.70 | LVN | ||||
| 1,348.60 | Monthly VAH | DAILY TARGETS | WEEKLY TARGETS | ||
| 1,339.00 | 55PEMA | BULL | BEAR | BULL | BEAR |
| 1,338.20 | LVN | 1,319.78 | 1,293.25 | 1,342.20 | 1,278.83 |
| 1,335.30 | nVPOC | 1,313.20 | 1,286.68 | 1,328.38 | 1,265.00 |
| 1,329.30 | nVPOC | 1,306.63 | 1,280.10 | ||
| 1,316.80 | cVPOC | 1,300.05 | 1,273.53 | ||
| 1,316.50 | LVN | *BOLD indicates primary objectives | |||
| 1,315.30 | Fib Ext | ||||
| 1,312.20 | HVN | ||||
| 1,311.70 | nVPOC | ||||
| 1,310.20 | PD High | ||||
| 1,305.30 | VPOC | ||||
| 1,301.90 | SETTLE | ||||
| 1,300.90 | Monthly TC | ||||
| 1,299.00 | LVN/62% Fib | ||||
| 1,296.70 | PD Low | ||||
| 1,293.50 | HVN | ||||
| 1,291.60 | Fib Ext | ||||
| 1,288.50 | LVN | ||||
| 1,283.75 | HVN | ||||


Pingback: Another Dip, Another Buy | PivotBoss