PB View
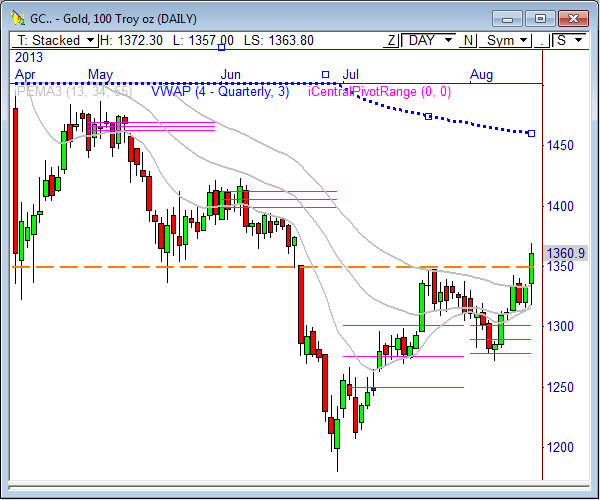
Gold rallied BIG Thursday, as it seems the market began to move money out of stocks and into safety. On the second trading day of the month, I called for Gold to rally big into the end of the month. Halfway through the month, Gold is already within a handful of points of reaching the bottom end of my target range, which shows how truly strong that Gold move was yesterday. Read more below.
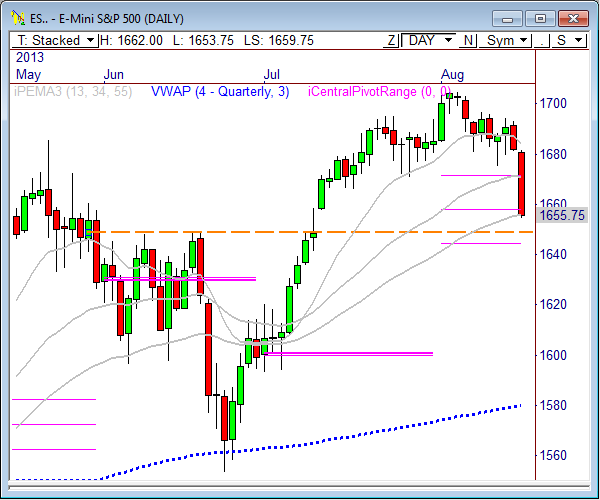
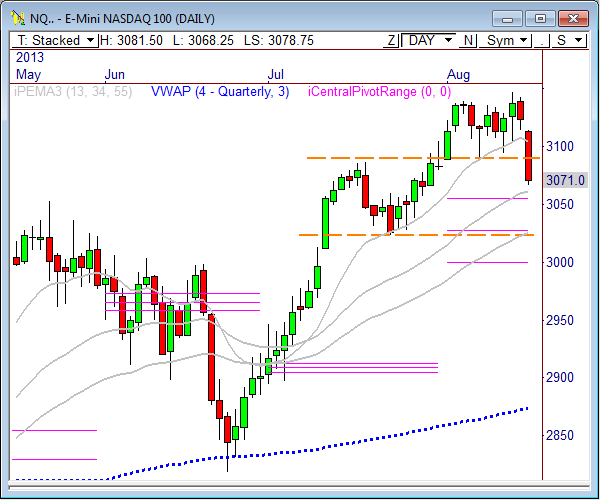
The S&P 500 and NASDAQ futures took a hit yesterday, and it doesn’t seem over. As a matter of fact, there are still some important levels to test down below, namely 1648.75 to 1650 in the ES. Keep your eye on this zone, as buyers could enter the market upon the first test. If not, look out below.
P.S. I’ve written this commentary and analysis for nearly two months, and I’ve received great feedback along the way. Thank you for your comments, emails, tweets, suggestions, and high fives!
My TOP GOAL is to deliver the BEST content available for the various products I cover, with a slant on being informative and actionable. If you could only see my vision for the Fall and beyond, you’ll know my excitement. I can’t wait.
Per the announcement earlier in the week, the analysis will become a subscription service as early as Monday, August 19. But I’ve got a great deal for you early adopters, so stay tuned!
Enjoy the weekend!
Cheers!
Frank Ochoa
PivotBoss | Own the Market
Follow me on Twitter: @PivotBoss
______________________________________________________
This daily report is currently free and open to the public, as I gather feedback and ideas ahead of a formal subscription offering later in the summer. If you have any feedback regarding anything in the report (good or bad) please provide it below in the comments section. Your comments will definitely help shape the report for the better. Thank you!
E-Mini S&P 500
On August 12, “Overall, the S&P remains very bullish. However, a further retracement from current levels may be a welcomed move, as auctioning lower will allow the market to find new buyers.”
I’ve made no bones about the 1700 to 1702.50 zone being “thick resistance” lately, and the recent sell-off away from this zone certainly confirmed this, especially after the inability to climb above 1697. But sometimes, the market must go lower in order to go higher, and it must go higher in order to go lower.
The fact that the S&P 500 has sold off is actually good for longer term health, as auctioning lower will entice new buyers to enter the market at better value, which could eventually lead to new highs down the road.
For now, keep an eye on 1648.75 to 1650. This is a big zone the market will want to test soon. I’d expect some buyers to enter here. If not, look out below. The market may need to test the 1665 to 1675 zone above before finding another big leg down, so watch for potential strength into this zone by early next week.
Short term, watch 1662 and 1653.75 for early directional breakout cues. The current high of 1662 predicts bear targets at 1664 and 1667.50, while the current low of 1653.75 forecasts bull targets at 1651.75 and 1648.25.
Here are the Key Levels and Targets for the current session:
| PivotBoss Levels & Targets: E-Mini S&P 500 (ESU3) | |||||
| Wed, Aug 14, 2013 | |||||
| KEY LEVELS | ADR TARGETS | ||||
| 1,722.50 | Monthly R1 | ADR (10) | ONH | ONL | |
| 1,713.00 | Monthly H3 | 13.00 | 1,692.50 | 1,685.25 | |
| 1,705.00 | LVN | AWR (10) | WH | WL | |
| 1,702.50 | Open Gap | 26.00 | 1,294.50 | 1,275.25 | |
| 1,702.50 | nVPOC | ||||
| 1,701.75 | HVN | DAILY TARGETS | WEEKLY TARGETS | ||
| 1,697.00 | LVN | BULL | BEAR | BULL | BEAR |
| 1,695.25 | Monthly VAH | 1,701.50 | 1,686.00 | 1,301.25 | 1,275.00 |
| 1,694.50 | PD High | 1,698.25 | 1,682.75 | 1,294.75 | 1,268.50 |
| 1,691.75 | VPOC | 1,695.00 | 1,679.50 | ||
| 1,690.75 | SETTLE | 1,691.75 | 1,676.25 | ||
| 1,687.00 | cVPOC | *BOLD indicates primary objectives | |||
| 1,687.00 | RTH MP | ||||
| 1,687.00 | ETH MP | ||||
| 1,679.25 | PD Low | ||||
| 1,673.00 | LVN | ||||
| 1,671.50 | Monthly TC | ||||
| 1,670.00 | HVN | ||||
| 1,665.50 | LVN | ||||
| 1,661.00 | LVN | ||||
E-Mini NASDAQ 100
On August 14 I wrote, “If the market can convert 3140 to support, we could see quite an upside push ahead. However, if the market rejects 3140 we could see another test down below at 3100.”
The E-Mini NASDAQ 100 clearly showed that 3140 was indeed the pivot to watch. As a matter of fact, I titled the entry “Watching 3140 in the NQ”, and the level delivered. Once the NQ rejected 3140, it was off to the races to 3100 for a test, which failed. The break of 3100 led to recent lows in the 3060s, but more downside could be ahead, if 3090 continues to hold as resistance.
I wrote about the 3090 level recently, and it has become a key line in the sand. Price retested 3090 after the morning decline yesterday, which sent prices lower upon a failure. If this level continues to hold, I’d be looking for 3057.75 to be tested soon. Depending on how hairy this sell-off gets, we’ll want to keep an eye on critical support below at 3023.
Short term, watch 3090 and 3065 for early directional breakout cues. The current high of 3081.50 predicts bear targets at 3066 and 3058, while the current low of 3068.25 forecasts bull targets at 3083.75 and 3091.75.
Here are the targets for the current session and the week ahead:
| PivotBoss Levels & Targets: E-Mini NASDAQ 100 (NQU3) | |||||
| Wed, Aug 14, 2013 | |||||
| KEY LEVELS | ADR TARGETS | ||||
| 3,160.50 | Monthly R1 | ADR (10) | ONH | ONL | |
| 3,148.00 | PD High | 28 | 3,141.75 | 3,131.25 | |
| 3,141.00 | Monthly H3 | AWR (10) | WH | WL | |
| 3,139.25 | VPOC | 65.25 | 3,148.00 | 3,094.25 | |
| 3,138.50 | LVN | ||||
| 3,138.50 | SETTLE | DAILY TARGETS | WEEKLY TARGETS | ||
| 3,132.25 | HVN | BULL | BEAR | BULL | BEAR |
| 3,126.50 | RTH MP | 3,166.25 | 3,127.75 | 3,159.50 | 3,099.06 |
| 3,126.50 | ETH MP | 3,159.25 | 3,120.75 | 3,143.19 | 3,082.75 |
| 3,116.00 | cVPOC | 3,152.25 | 3,113.75 | ||
| 3,110.00 | HVN | 3,145.25 | 3,106.75 | ||
| 3,105.25 | LVN | *BOLD indicates primary objectives | |||
| 3,104.75 | PD Low | ||||
| 3,104.75 | 13PEMA | ||||
| 3,093.00 | HVN | ||||
| 3,089.50 | LVN | ||||
| 3,075.00 | HVN | ||||
| 3,069.50 | nVPOC | ||||
| 3,062.75 | LVN | ||||
| 3,034.00 | HVN | ||||
Crude Oil
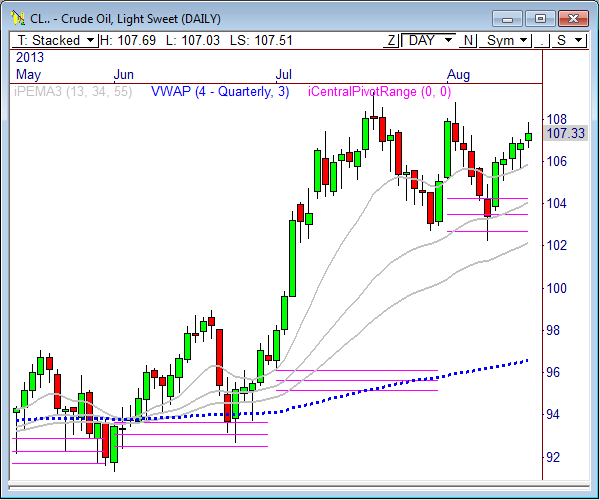
On August 12 I wrote, “If price can remain above the 105 level, we could see another round of strength higher toward 107.50, and even 109.”
After Crude Oil got the impressive reversal from the 102.22 LVN, I wrote that we could see a move to 105.75, followed by 106.83. Once price rallied to this zone, I updated the targets to 107.50 and 109. Crude Oil finally hit 107.50 during Thursday’s market and is currently holding within the framework of a nice uptrend, which makes 108 to 109 a big possibility soon.
As a matter of fact, on July 3 I wrote, “I mentioned yesterday that a break through the 100 level opens the door to 105, and even 110. This is a medium term outlook for Crude, and you see how bullish it has become. From a longer term perspective, the weekly and monthly charts indicate a breakout from the 2.5-year coiled range could lead to much higher levels down the road”
So far, the move from my 100 call to the current 107.50 is $7,500 move per contract. However, the swings back and forth within the wide 7-point range makes that number pale in comparison. I don’t believe I can recall another wide trading range like this in Crude that has produced so many points. Truly fantastic.
Crude is now approaching the upper portion of the range between 108 and 109, which is quiet frothy. I’d be cautious in this zone, and I’ll be looking for signs of another sell-off soon.
The current low of 107.03 forecasts bull targets at 108.01 and 108.50, while the current high of 107.69 suggests bear targets at 106.71 and 106.22.
Here are the targets for the current session and the week ahead:
| PivotBoss Levels & Targets: Crude Oil (CLU3) | |||||
| Wed, Aug 14, 2013 | |||||
| KEY LEVELS | ADR TARGETS | ||||
| 110.00 | Yearly R1 | ADR (10) | ONH | ONL | |
| 108.68 | Monthly H3 | 2.23 | 106.69 | 105.92 | |
| 108.48 | LVN | AWR (10) | WH | WL | |
| 108.00 | LVN | 5.21 | 107.20 | 105.03 | |
| 107.59 | nVPOC | ||||
| 107.55 | Monthly VAH | DAILY TARGETS | WEEKLY TARGETS | ||
| 107.33 | LVN | BULL | BEAR | BULL | BEAR |
| 107.01 | PD High | 108.71 | 105.58 | 110.24 | 103.29 |
| 107.00 | LVN | 108.15 | 105.02 | 108.94 | 101.99 |
| 106.83 | HVN | 107.59 | 104.46 | ||
| 106.77 | SETTLE | 107.04 | 103.90 | ||
| 106.38 | ETH MP | *BOLD indicates primary objectives | |||
| 106.28 | RTH MP | ||||
| 106.11 | VPOC | ||||
| 105.97 | cVPOC | ||||
| 105.56 | PD Low | ||||
| 105.42 | HVN | ||||
| 104.89 | HVN | ||||
| 104.04 | LVN | ||||
| 103.09 | HVN | ||||
| 102.64 | nVPOC | ||||
| 102.25 | LVN | ||||
Gold
On August 2 I wrote, “The average monthly range over the last 10 months is 135.1 points in GC. If Friday’s low of 1282.40 is the low for the month, then we could be looking at upside monthly targets of 1383.70 and 1417.50 for August.”
Gold prices saw a HUGE rally during Thursday’s session, as price dropped right into the 1317 LVN noted in our Key Levels ladder below and rocketed 50 points higher, eventually reaching a RTH high of 1367.90. On the second day of August, I wrote that I thought Gold prices would rally, and I gave two very lofty upside targets of 1383.70 and 1417.50, and we are already within 9 points of hitting the bottom end of the target range, with half the month to go.
So far, the call has been worth about $7000 per contract traded.
Since Gold actually set a new monthly low of 1271.80 before rallying, the monthly bull targets can be updated to 1373.10 and 1406.90. Also, there’s a big HVN that likely needs to be tested at 1391.50, so use that level as a target, as well.
The daily chart shows Gold finally got a big break through the 1350 resistance level, which is still a very important LVN. If Gold can form a higher low above 1350, or convert it to support, we could see another big wave of strength heading into the end of the month.
Given Thursday’s huge range of movement, don’t expect a whole lot of trading activity from Gold Friday. The current pre-market low of 1357 forecasts bull targets at 1370.80 and 1377.60, while the pre-market high of 1372.30 suggests bear targets at 1358.60 and 1351.70.
Here are the targets for the current session and the week ahead:
| PivotBoss Levels & Targets: Gold (GCQ3) | |||||
| Fri, Aug 16, 2013 | |||||
| KEY LEVELS | ADR TARGETS | ||||
| 1,391.50 | HVN | ADR (10) | ONH | ONL | |
| 1,371.80 | Monthly R1 | 27.5 | 1,372.30 | 1,357.00 | |
| 1,367.90 | PD High | AWR (10) | WH | WL | |
| 1,359.70 | SETTLE | 48.00 | 1,372.30 | 1,313.50 | |
| 1,357.50 | LVN | ||||
| 1,351.20 | Monthly H3 | DAILY TARGETS | WEEKLY TARGETS | ||
| 1,350.00 | LVN | BULL | BEAR | BULL | BEAR |
| 1,348.40 | Monthly VAH | 1,391.38 | 1,358.55 | 1,361.50 | 1,336.30 |
| 1,343.70 | ETH MP | 1,384.50 | 1,351.68 | 1,349.50 | 1,324.30 |
| 1,343.00 | RTH MP | 1,377.63 | 1,344.80 | ||
| 1,342.70 | LVN | 1,370.75 | 1,337.93 | ||
| 1,339.70 | nVPOC | *BOLD indicates primary objectives | |||
| 1,338.00 | LVN | ||||
| 1,326.40 | HVN | ||||
| 1,325.50 | VPOC | ||||
| 1,317.90 | PD Low | ||||
| 1,317.00 | LVN | ||||


Pingback: E-Mini S&P 500 Key Levels and Analysis | PivotBoss