NOTE: You are viewing the Premium Market Wrap for Premium members. If you’d like to subscribe, please visit: http://pivotboss.com/premium-membership/.
The E-Mini S&P 500 endured a bit of a roller coaster day, as the release of the FOMC Meeting minutes led to some great volatility and big price swings. The ES initially sold off after the release, but buy programs kicked in 2 ticks above an unfilled gap at 1635.75, which sparked a rally of 18.50 points over the next 40 minutes. Keep in mind, the ES is only averaging 15.75 points per day, so to do that in eight 5-minute bars is impressive.
I tweeted the following message just four minutes after the market reached the high of the day:
Key resistance levels across the board: $ES_F 55-57, $EMD_F 1212-13, $NQ_F 3100, $YM_F 15000
— Frank Ochoa (@PivotBoss) August 21, 2013
The rest is history, as the ES gave back the entire move and eventually closed the day just one tick above the low of the session.
Medium Term Outlook
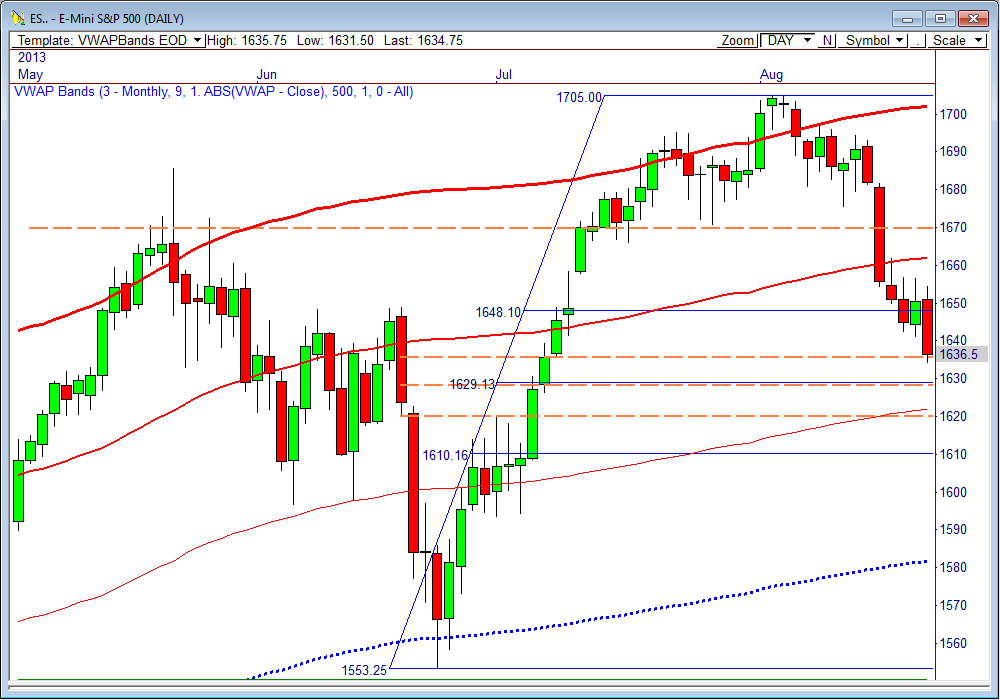
The ES continues to march lower toward 1620 after firing a Max Reversal sell signal, which I wrote about on August 1 at MrTopStep. The first target is the first standard deviation band, which has now moved higher to 1622 from 1620. I’m expecting the market to bounce off 1620 upon first test, but I’m still working on this theory.
The question becomes, will we bounce higher from current levels and reach 1622 down the road, or will we see 1622 tomorrow? I know it’s still early, but the current overnight high in the ES is 1637.75, which puts Thursday’s 100% bear target at 1620. Let’s see if we get it.
I expect 1629 to put up a fight, however, as this level is the midpoint of the recent move from the 1553.25 low to the 1705 high. Additionally, I have 1628.25 marked as a potential buy program level, which coincides with the open gap at that level.
If the 1628 to 1629 zone catches a bid, I could see a scenario where some large buy programs kick off.
Up top, the bulls don’t have a leg to stand on until they can get the spoos above 1657. The key levels beyond that are 1670 and 1681.50.
Check out the table below, which shows the weekly and monthly targets for various contracts I’m trading:
| Aug 22, 2013 | PivotBoss ADR METHOD TARGETS | |||||||
| WEEKLY | MONTHLY | |||||||
| AWR (5) | WH | WL | Range | AMR (10) | MH | ML | Range | |
| ESU3 | 29.50 | 1657.00 | 1631.50 | 25.50 | 78.00 | 1705.00 | 1631.50 | 73.50 |
| BULL | 1,653.63 | 1661.00 | 1,690.00 | 1709.50 | ||||
| BEAR | 1,627.50 | 1634.88 | 1,627.00 | 1646.50 | ||||
| NQU3 | 63.75 | 3100.50 | 3055.50 | 45.00 | 161 | 3148 | 3055.50 | 92.50 |
| BULL | 3,103.3125 | 3,119.25 | 3,176.25 | 3216.50 | ||||
| BEAR | 3,036.75 | 3,052.69 | 2,987.0 | 3027.25 | ||||
| CLV3 | 4.47 | 107.60 | 103.50 | 4.10 | 8.31 | 107.95 | 101.82 | 6.13 |
| BULL | 106.85 | 107.97 | 108.05 | 110.13 | ||||
| BEAR | 103.13 | 104.25 | 99.64 | 101.72 | ||||
| GCZ3 | 67 | 1384.1 | 1351.6 | 32.50 | 133.7 | 1384.1 | 1271.80 | 112.3 |
| BULL | 1,401.9 | 1,418.6 | 1,372.1 | 1,405.5 | ||||
| BEAR | 1,317.1 | 1,333.9 | 1,250.4 | 1,283.8 | ||||

