Monday’s market was rather dull for most of the session. The market opened bullish and pushed quietly higher throughout most of the morning. However, a late-day sell program kept things interesting in the E-Minis, as prices sold off heavily from key overhead resistance levels.
Double Top in the NQ
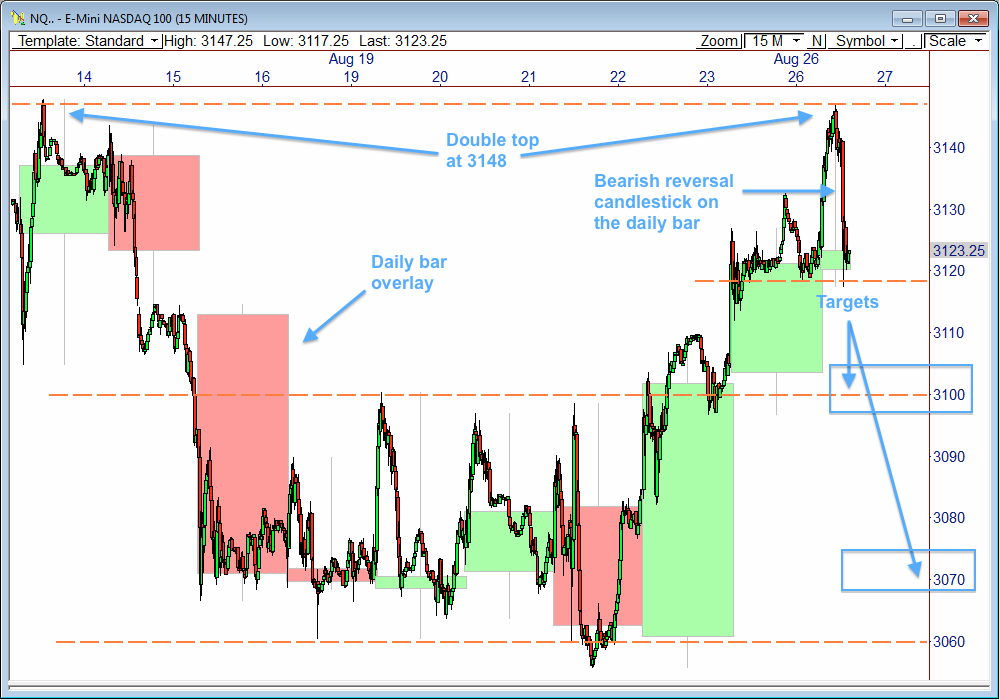
The 15-minute chart of the E-Mini NASDAQ 100 shows price tested key resistance at 3148, which happens to be the high for the year thus far. Price immediately sold off 10 points upon reaching the 3147.25 high, and then churned sideways for about 75 minutes before a big sell program hit the market. Prices dropped nearly 23 points in 20 minutes after the sell program hit.
The result is an early formation of a double top in the NQ, which could lead to a retest of 3100 down below, followed by a decline down to between 3060 and 3070.
You’ll also notice that I overlaid the daily bar candlesticks on the 15-minute chart. This helps to emphasize the extreme reversal the NQ experienced today, which left quite a reversal tail off the 3148 resistance level. This could be quite bearish ahead.
It’s Still Early
The bears have cast the first stone off 3148 resistance in the NQ, but the bulls aren’t finished yet. There’s a fair bit of support between 3115 and 3121.25. As a matter of fact, 3121.75 is also the composite VPOC, so there’s a lot of interest at this zone.
Also, 3100 is still below. Round numbers can spark buy and sell programs by themselves, so this will be a zone where the bulls could stage a rally. Below 3100 suggests a move to 3060 to 3070.
The Game Plan
While the bulls have a shot to retest highs, I think there’s enough evidence to suggest we see lower prices from here, at least down to 3100, if not lower. As a matter of fact, we have our primary weekly bear target at 3096.75, so that’s a great target to shoot for.
I’ll be looking for early signs of weakness for Tuesday’s market. Any rally into the 3132.75 to 3135.75 zone would be my ideal sell entry zone, but I’ll also look to the 3126 to 3132.25 zone for a sell entry, as well.
I’ll be looking to take the first half of the trade off at 3105.25, and will look to cover the second half of the trade much lower, depending on how price behaves. The downside targets I have in mind for the last half of the trade are 3096.75, 3071, and 3061. But don’t forget, if the market breaks 3060 there’s a lot more downside to come, so I’ll keep this in mind.
| Aug 26, 2013 | PivotBoss ADR METHOD TARGETS | |||||||
| WEEKLY | MONTHLY | |||||||
| AWR (5) | WH | WL | Range | AMR (10) | MH | ML | Range | |
| ESU3 | 37.25 | 1667.50 | 1653.50 | 14.00 | 78.00 | 1705.00 | 1631.50 | 73.50 |
| BULL | 1,681.44 | 1690.75 | 1,690.00 | 1709.50 | ||||
| BEAR | 1,630.25 | 1639.56 | 1,627.00 | 1646.50 | ||||
| NQU3 | 67.25 | 3147.25 | 3117.25 | 30.00 | 161 | 3148 | 3055.50 | 92.50 |
| BULL | 3,167.6875 | 3,184.5 | 3,176.25 | 3216.50 | ||||
| BEAR | 3,080.00 | 3,096.81 | 2,987.0 | 3027.25 | ||||
| CLV3 | 4.22 | 107.37 | 105.56 | 1.81 | 8.31 | 107.95 | 101.82 | 6.13 |
| BULL | 108.73 | 109.78 | 108.05 | 110.13 | ||||
| BEAR | 103.15 | 104.21 | 99.64 | 101.72 | ||||
| GCZ3 | 62.2 | 1407 | 1388.4 | 18.60 | 133.7 | 1407 | 1271.80 | 135.2 |
| BULL | 1,435.1 | 1,450.6 | 1,372.1 | 1,405.5 | ||||
| BEAR | 1,344.8 | 1,360.4 | 1,273.3 | 1,306.7 | ||||

