Wouldn’t it be great to know what kind of trading behavior we’re likely to see in tomorrow’s market? The ability to anticipate trading behavior for the following session is a trait that separates great traders from the rest – and I have a simple solution to help you get started!
Pivot Width Analysis is one of my favorite forms of analysis because it’s simple and it works. This article is the first of a three part series that will take a look at how I use pivot width analysis to forecast price behavior.
In this first piece, I will use the central pivot range as my indicator of choice, although I will explore how I use pivot width analysis with Money Zone levels and the Camarilla Equation in Part 2 and Part 3 of the series.
I recommend you read A Quick Guide to the Pivot Range if you need a refresher on this indicator.
What is Pivot Width Analysis?
Pivot Width Analysis involves judging the width of a set of pivots in order to forecast whether the following day (or month or year) will bring about trading range or trending behavior.
Simply put, an extremely narrow pivot range forecasts trending behavior, while an extremely wide pivot range forecasts sideways or trading range behavior.
The ability to anticipate the upcoming session’s price behavior will help you pull together a plan of action for trading the day.
When judging the width of the central pivot range I am referring to the distance between the top central pivot and the bottom central pivot (TC to BC).
An extremely narrow central pivot range indicates the market traded sideways or consolidated in the prior period of time (from which the high, low, and close were derived to calculate the pivots). As such, this price behavior usually leads to breakout or trending behavior in the following session.
Conversely, an extremely wide central pivot range indicates the market experienced a wide range of movement in the prior day, which usually leads to sideways or trading range behavior in the following session.
The operative word here is “extremely”. That is, it must be clear that the width of the pivots is either abnormally wide or narrow, as these are the sessions that lend themselves to a higher probability of forecasting success. If the pivot width is not distinctly wide or narrow, it becomes very difficult to predict potential price behavior with any degree of certainty.
You must also keep in mind that this analysis is not without fault. Measuring pivot width gives you a significant edge in determining the potential behavior for the upcoming session, but like any form of technical analysis this method is not always correct and should be used as a guideline.
Practical Application
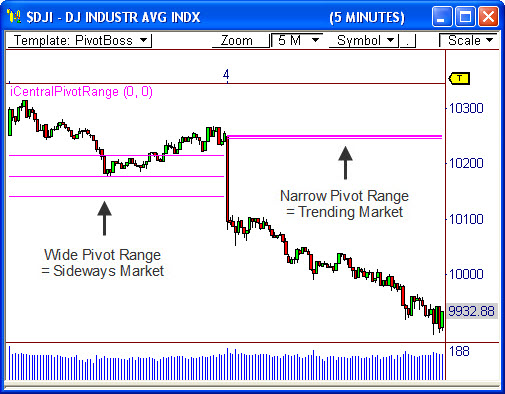
Take a look at the 5-minute chart off the Dow Jones Industrial Average. The wide-set pivot range on June 3rd forecasted sideways/trading range behavior, which did indeed occur. The quiet trading behavior led to extremely narrow pivots for June 4th, which helped to forecast the 300 point breakout move! The narrow pivot range easily helped us anticipate this move.
Knowing that the pivots were extremely wide for June 4th would have led you to keep a longer leash on your trades in order to capture as much of the trending move as possible. Likewise, knowing that the pivots were wider than normal for June 3rd would have led you to tighten your stops and shorten your targets in order to play the back and forth trading range action.
Being a trader means being prepared and anticipating what the market is likely to do. Any edge that you can capture that helps you toward this end is one that you should consider. By knowing in advance that the market may not move on a given day, or may move tremendously, you are allowing yourself to allocate your capital appropriately and judiciously.
In Part 2 and Part 3 of the series, I will show you how I use the Money Zone and the Camarilla Equation for Pivot Width Analysis…stay tuned!
In future blog posts, I will show you how I identify pivot width characteristics before the next day’s trading even occurs.
What do you think about this form of analysis? Leave a comment!
Frank Ochoa
PivotBoss.com
Follow Frank on Twitter: http://twitter.com/PivotBoss


Pingback: A Quick Guide to the Pivot Range | PivotBoss.com
Pingback: Energy Futures Are Winding Up | PivotBoss.com
Pingback: Pivot Width Analysis (Part 2 of 3) | PivotBoss.com
Pingback: Pivot Width Analysis (Part 3 of 3) | PivotBoss.com
Glad to see people still using the Pivot Points I taught when I ran Commodity Boot Camp.
neal weintraub
yourfilled@yahoo.com
Pingback: Identifying the kind of day early on - Traders Hideout
Great insight thank you Franklin, I am reading through your book at present, I began using the two day relationships earlier this week trading the Eurodollar, it is a real eye opener to see these relationships play out, thank you for sharing your knowledge I am very grateful. Wish you success, do you have any more book plans for the near future?