Copper Futures has been coiling the last two months and looks primed for a major breakout opportunity. I’ve got a few reasons to keep your eye on this commodity.
1. The Triangle
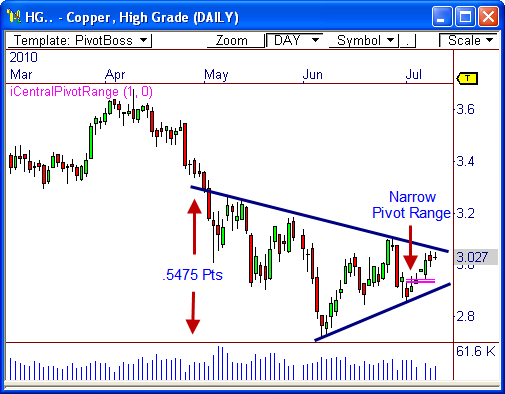
The daily chart of the continuous contract of Copper futures shows a large triangle that has developed over the last two months. Price has coiled toward the apex of the pattern, which means a breakout could be near.
The fact that the height of the pattern measures out to .5475, indicates a breakout could lead to a move that is equal to this measurement. Therefore, if an upside break occurs through 3.1, we could see a target back toward the April high at around 3.6475 – that’s a big move!
For a confirmed breakout from this triangle in either direction, I’ll be watching 3.10 up, and 2.85 down.
2. Tight Pivot Range for July
The central pivot range for the month of July is extremely tight, which usually forecasts a breakout or trending environment. If price does indeed get a breakout from the triangle, very nice trending behavior could be seen.
To read more about Pivot Width Analysis, read my three-part series HERE.
3. Weekly Chart Support
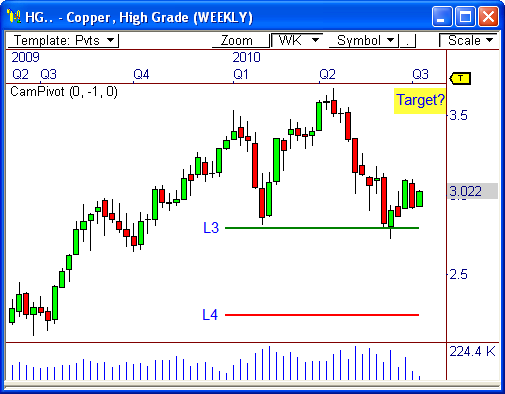
The weekly chart shows Copper has been sitting on pivot-based support all year. As a matter of fact, the yearly L3 Camarilla level is 2.80, which has served as a clear level of support (both visual and pivot-based). If this level continues to hold, we could see an upside break through the top of the triangle that leads to a rally back toward the year’s high.
Otherwise, a violation of L3 support could push this commodity back toward the yearly L4 support level at about 2.25.
To learn more about the Camarilla Equation, read my primer HERE.
Either way, this metal is poised to move in a big way…
Cheers!
Frank Ochoa
PivotBoss.com
Follow Frank on Twitter: http://twitter.com/PivotBoss


