PB View
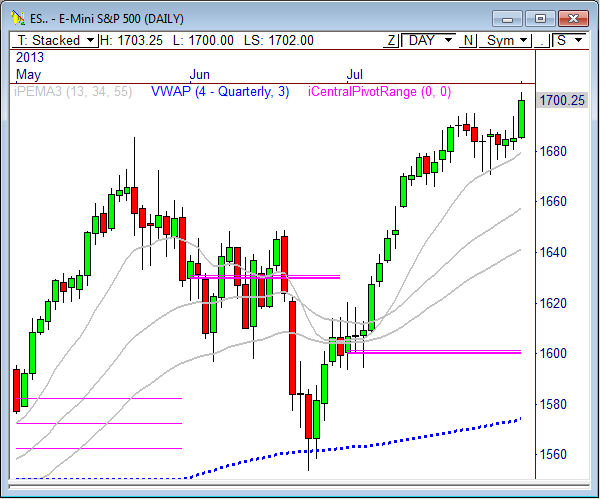
The S&P 500 futures can finally check “Reach 1700” off its to-do list, as the ES finally reached this highly anticipated, psychological milestone, while Gold continues it wild and volatile run. As a matter of fact, not only did the ES reach 1700, it hung out at this level the entire session, and even into pre-market trading Friday morning, while Gold has traded in wild swings above and below 1300.
What’s more fascinating is the fact that the NFP number came out at 7:30am CT and was 22k under expectations, and yet the ES continues to hold and trade around 1700, which could lead to another wave of strength ahead, likely toward 1709.50. But short term, we’ll have to keep an eye on 1695 for early directional cues today.
Gold had some fascinating price movement this morning, and could be headed much higher if today’s low holds throughout the month. You’ll definitely want to read that analysis below, so check it out.
Cheers!
Frank Ochoa
PivotBoss | Own the Market
Follow me on Twitter: @PivotBoss
______________________________________________________
This daily report is currently free and open to the public, as I gather feedback and ideas ahead of a formal subscription offering later in the summer. If you have any feedback regarding anything in the report (good or bad) please provide it below in the comments section. Your comments will definitely help shape the report for the better. Thank you!
E-Mini S&P 500
In yesterday’s ES report I wrote, “The current overnight low of 1684.50 points to a primary bull target of 1694.75, with a shot to reach 1698.25 and 1701.75.”
The E-Mini S&P 500 futures opened Thursday’s RTH trading with a gap beyond the prior day’s range and held the 5-minute opening range low the entire session, as the ES pushed slowly into each of our targets mentioned above.
The daily chart shows the E-Mini S&P 500 futures have gotten a firm break through the top of the tightly-coiled range, which had developed over the prior three weeks. If price can continue to hold above 1690, there’s a great shot to continue pushing higher out of this pattern. As a matter of fact, there’s still a weekly target that needs to be reached at 1704.75, and there’s a confluence of analysis that points to a test at 1709.50, as well. Lastly, the size of the range that was recently broken forecasts a move to 1723, so keep this level in mind should price push through 1709.50 at some point over the next few days.
The current overnight high of 1703.75 forecasts downside targets at 1692.75 and 1689.25. The current overnight low of 1696 forecasts upside targets at 1703 and 1706.50.
Today’s scheduled economic news:
7:30am CT Non-Farm Employment Change
7:30am CT Unemployment Rate
7:30am CT Average Hourly Earnings m/m
7:30am CT Core PCE Price Index m/m
7:30am CT Personal Income m/m
7:30am CT Personal Spending m/m
9:00am CT Factory Orders m/m
11:15am CT FOMC Member Bullard Speaks
Here are the Key Levels and Targets for the current session:
| PivotBoss Levels & Targets: E-Mini S&P 500 (ESU3) | |||||
| Fri, Aug 2, 2013 | |||||
| KEY LEVELS | ADR TARGETS | ||||
| 1,708.25 | Monthly R2 | ADR (10) | ONH | ONL | |
| 1,699.00 | VPOC | 14.00 | 1,703.25 | 1,696.00 | |
| 1,697.75 | Monthly H5 | AWR (10) | WH | WL | |
| 1,703.75 | PD High | 28.25 | 1,703.75 | 1,676.50 | |
| 1,693.00 | LVN | ||||
| 1,686.75 | nVPOC | DAILY TARGETS | WEEKLY TARGETS | ||
| 1,683.50 | cVPOC | BULL | BEAR | BULL | BEAR |
| 1,700.75 | SETTLE | 1,713.50 | 1,696.25 | 1,704.75 | 1,682.56 |
| 1,694.25 | PD Low | 1,710.00 | 1,692.75 | 1,697.69 | 1,675.50 |
| 1,677.50 | HVN | 1,706.50 | 1,689.25 | ||
| 1,675.50 | 13PEMA | 1,703.00 | 1,685.75 | ||
| 1,672.00 | LVN | *BOLD indicates primary objectives | |||
| 1,670.00 | HVN | ||||
| 1,666.25 | LVN | ||||
| 1,664.25 | nVPOC | ||||
| 1,662.00 | LVN | ||||
| 1,656.00 | HVN | ||||
| 1,652.25 | LVN | ||||
| 1,648.75 | Open Gap | ||||
E-Mini NASDAQ 100
In yesterday’s NQ report I wrote, “If price continues to hold above 3092.5, we are likely to see further strength into our primary bull target of 3110, with a shot at seeing 3117.25. If price stays above 3080, I’ll keep an eye on the weekly bull targets of 3107.25 and 3124.”
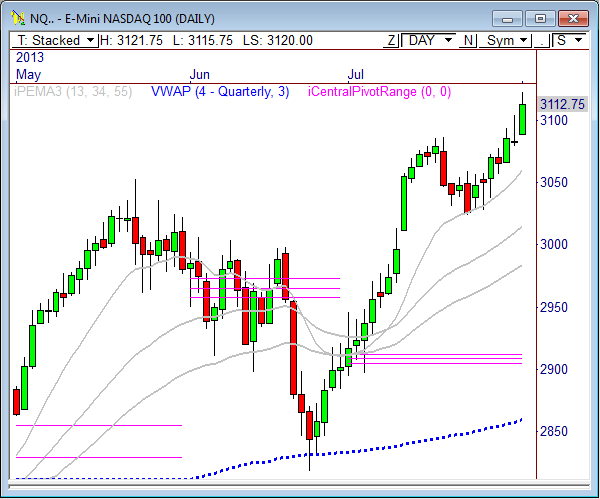
The E-Mini NASDAQ 100 futures rallied nicely in pre-market trading Thursday morning, which held throughout the RTH session, as price rallied to each of the targets mentioned above and came within a half point of reaching the weekly target of 3124.
I bought the NQ at 3102.25 in pre-market trading scaled out of the position throughout the session and actually held my final target at 3123.75 for much of the day. However, I pulled the target late in the session and actually closed out the final leg of the trade minutes before the last push to 3123.50.
The E-Mini NASDAQ 100 futures continue to look strong in the daily chart. Price held the 13-period PEMA at 3025 two weeks ago, and we’re already 100 points off that level. If price can continue to hold above the 3100 to 3105 zone in the short term, we could see more upside ahead. However, the real determining pivot in the chart seems to be 3080. If the bulls can hold this line, there could be another wave of strength ahead. Otherwise, a failure to hold 3080 could get the bears to come out of the woodwork.
The current overnight high of 3126.75 forecasts downside targets at 3113 and 3106. The current overnight low of 3115.50 forecasts upside targets at 3129.50 and 3136.25.
Here are the targets for the current session and the week ahead:
| PivotBoss Levels & Targets: E-Mini NASDAQ 100 (NQU3) | |||||
| Fri, Aug 2, 2013 | |||||
| KEY LEVELS | ADR TARGETS | ||||
| 3,119.00 | Monthly R2 | ADR (10) | ONH | ONL | |
| 3,123.50 | PD High | 27.75 | 3,126.75 | 3,115.50 | |
| AWR (10) | WH | WL | |||
| 3,110.00 | VPOC | 67.25 | 3,126.75 | 3,056.75 | |
| 3,096.00 | Monthly H5 | ||||
| 3,093.00 | nVPOC | DAILY TARGETS | WEEKLY TARGETS | ||
| 3,086.00 | LVN | BULL | BEAR | BULL | BEAR |
| 3,116.75 | SETTLE | 3,150.19 | 3,112.88 | 3,124.00 | 3,076.31 |
| 3,105.25 | PD Low | 3,143.25 | 3,105.94 | 3,107.19 | 3,059.50 |
| 3,074.75 | HVN | 3,136.31 | 3,099.00 | ||
| 3,069.50 | nVPOC | 3,129.38 | 3,092.06 | ||
| 3,067.00 | LVN | *BOLD indicates primary objectives | |||
| 3,058.75 | LVN | ||||
| 3,049.50 | nVPOC | ||||
| 3,046.25 | LVN | ||||
| 3,046.00 | 13PEMA | ||||
| 3,034.00 | cVPOC | ||||
| 3,027.50 | LVN | ||||
| 3,008.00 | nVPOC | ||||
Crude Oil
In yesterday’s Crude report I wrote, “Crude has already surpassed most of the day’s bull targets, but one is still above – 107.65. Watch this zone closely, as the 107.50 to 107.65 zone could offer resistance if probed.”
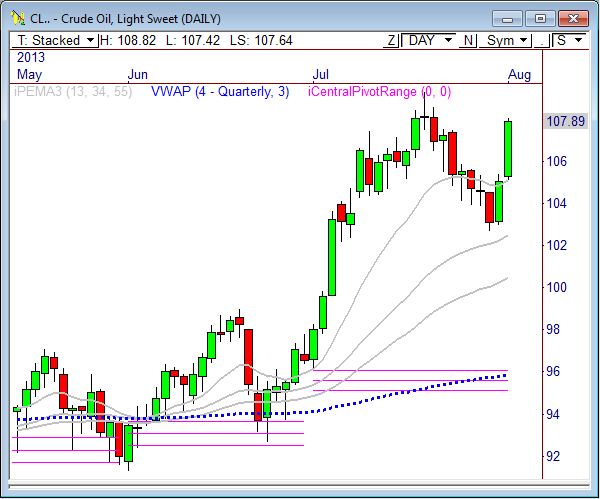
Another day, another huge rally for Crude. Black gold rallied 3 points during Thursday’s market, which is a huge number considering it had only been averaging 2 points per day over the last 10 sessions. Price rallied right into the final target at 107.65 mentioned above, and then held 108 into the close, capping a huge day.
Given the wide range of movement that Crude has seen over the last two days, I’d say price may be due for a “digestion” day. Look for Crude to establish a range and trade moderately quietly compared to the wild strength that we’ve seen the last two days.
The current high of 108.82 indicates weakness down to 106.71, while the recent low of 107.02 indicates a potential bounce back to 108.08.
Here are the targets for the current session and the week ahead:
| PivotBoss Levels & Targets: Crude Oil (CLU3) | |||||
| Fri, Aug 2, 2013 | |||||
| KEY LEVELS | ADR TARGETS | ||||
| 110.00 | Yearly R1 | ADR (10) | ONH | ONL | |
| 108.48 | LVN | 2.11 | 108.82 | 107.02 | |
| 107.71 | Monthly R3 | AWR (10) | WH | WL | |
| 107.59 | VPOC | 4.32 | 108.82 | 102.67 | |
| 107.35 | LVN | ||||
| 106.25 | LVN | DAILY TARGETS | WEEKLY TARGETS | ||
| 105.96 | cVPOC | BULL | BEAR | BULL | BEAR |
| 108.06 | PD High | 109.66 | 107.77 | 106.99 | 105.58 |
| 107.87 | SETTLE | 109.13 | 107.24 | 105.91 | 104.50 |
| 104.86 | HVN | 108.60 | 106.71 | ||
| 104.80 | nVPOC | 108.08 | 106.18 | ||
| 104.59 | nVPOC | *BOLD indicates primary objectives | |||
| 104.00 | LVN | ||||
| 102.69 | LVN | ||||
| 106.71 | PD Low | ||||
| 102.20 | LVN | ||||
| 102.07 | 34PEMA | ||||
Gold
In Friday’s Gold report I wrote, “Short term, the 1315 and 1330 levels are the key zones to watch. Look to play reversals within this range until a breakout occurs. The current high of 1330.1 projects bear targets for the day at 1318.10 and 1311.7.”
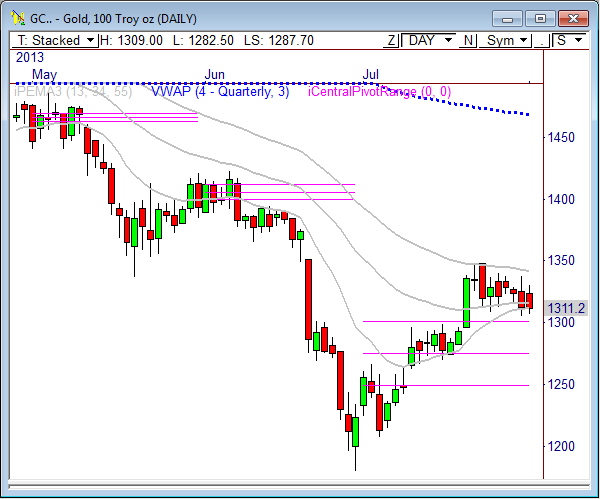
Gold and Crude have been trading wild lately. Big time price movement, and big time volatility, which is fantastic if you’re disciplined. Gold dropped from the session highs Thursday morning and pushed right into both bear targets mentioned above after breaking through the key 1315 level. Gold held 1310 heading into overnight trading, but eventually sold off heavily down to 1285, where a giant buy program kicked off, sending price back to 1317.50 as of this writing.
It may be no surprise that current rally kicked off right within the monthly pivot range for August, which could mean we are headed much higher this morning. As a matter of fact, the monthly pivot range has formed an Inside Value relationship, which can be one of the most telling patterns when it comes to range expansion.
The average monthly range over the last 10 months is 135.1 points in GC. If Friday’s low of 1282.40 is the low for the month, then we could be looking at upside monthly targets of 1383.70 and 1417.50 for August.
Here are the targets for the current session and the week ahead:
| PivotBoss Levels & Targets: Gold (GCQ3) | |||||
| Fri, Aug 2, 2013 | |||||
| KEY LEVELS | ADR TARGETS | ||||
| 1,385.50 | cVPOC | ADR (10) | ONH | ONL | |
| 1,371.40 | Monthly R1 | 26.3 | 1,318.00 | 1,282.40 | |
| 1,357.80 | Monthly H4 | AWR (10) | WH | WL | |
| 1,348.70 | LVN | 56.70 | 1,338.40 | 1,282.50 | |
| 1,343.20 | 55PEMA | ||||
| 1,338.20 | LVN | DAILY TARGETS | WEEKLY TARGETS | ||
| 1,329.50 | cVPOC | BULL | BEAR | BULL | BEAR |
| 1,328.00 | PD High | 1,315.28 | 1,304.85 | 1,339.20 | 1,295.88 |
| 1,316.50 | LVN | 1,308.70 | 1,298.28 | 1,325.03 | 1,281.70 |
| 1,315.70 | 34PEMA | 1,302.13 | 1,291.70 | ||
| 1,311.00 | SETTLE | 1,295.55 | 1,285.13 | ||
| 1,310.00 | LVN | *BOLD indicates primary objectives | |||
| 1,309.00 | 50% Fib | ||||
| 1,312.10 | VPOC | ||||
| 1,307.10 | PD Low | ||||
| 1,301.30 | Monthly TC | ||||
| 1,299.00 | LVN/62% Fib | ||||


Hi Frank,
Do you primarily use Volume Profile now rather than Market Profile? In your book, it seemed you primarily use Market Profile. Thanks.
Pingback: Tight Range in the S&P | PivotBoss
Hi! I use both in my trading and analysis, but I use Volume Profile quite a bit more overall.