After last week’s price action, the Dow Jones Industrial Average has strung together two sessions of yawn-inducing trading activity. However, the Dow could be on the verge of a major breakout opportunity. I’ve got three reasons why.
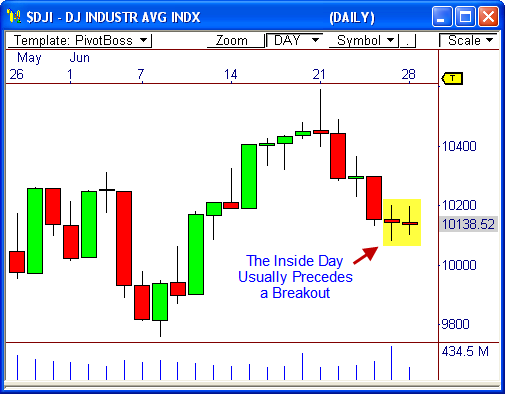
1. The Dow has formed an Inside Day candlestick pattern in the Daily Chart.
The daily chart shows the Dow has formed an Inside Day candlestick pattern, whereby today’s range (Low to High) is engulfed by the prior day’s range (Low to High).
This pattern usually precedes a breakout opportunity, allowing us to forecast a potential trending day in the market, which is why many professionals like to know when it has developed.
This pattern alone is worth its weight in gold and can forecast a one to five-day move. But since I’m a fan of lists, I’ll move on to reason number two.
2. The Dow has formed a Two-Day Inside Value relationship.
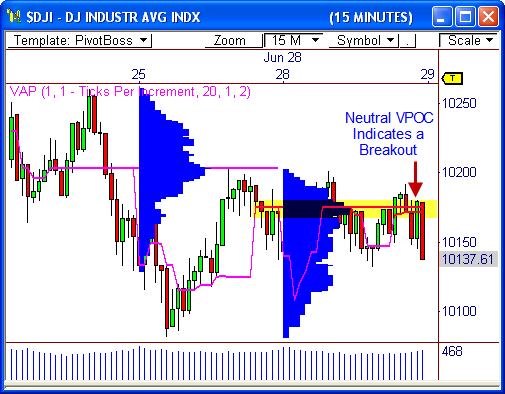
The 15-minute chart shows the Dow has formed a 2-Day Inside Value relationship, which occurs when the upcoming day’s Value Area (VAL to VAH) is engulfed by the prior day’s Value Area (VAL to VAH).
This two-day relationship indicates price is winding up for a breakout opportunity, thereby giving you advanced notice that a big day could be seen.
If you need a primer on the Market Profile and the Value Area, take a look at my post entitled “Market Profile Made Easy”.
3. The Dow has formed a Two-Day Neutral relationship.
The 15-minute chart shows the Volume at Price Indicator has formed a Two-Day Neutral relationship, which occurs when the VPOC is identical (or very close) for two sessions in a row.
Basically, this relationship indicates a fair facilitation of trade has occurred within a small price range. This relationship usually precedes a breakout, as traders will begin to seek new value.
If you need a primer on the Volume at Price Indicator or VPOC, take a look at “Volume at Price for Dummies” on our Education Page.
The fact that various metrics are pointing to the same outcome indicates a strong possibility for movement tomorrow.
However, as I like to say, you must allow the market to prove (or disprove) your theory.
If the Dow can get a strong 15-minute close beyond 10,200 or 10,100 to begin the day, we could see nice trending behavior throughout the session – or at least during the morning. Let’s see what the market decides!
Have any thoughts? Drop me a comment!
Cheers!
Frank Ochoa
PivotBoss.com
Follow Frank on Twitter: http://twitter.com/PivotBoss


Pingback: Anatomy of a Winning Trade | PivotBoss.com
Pingback: PivotBoss.com's Greatest Hits | PivotBoss.com
Pingback: 3 Reasons to Watch Amazon | PivotBoss.com