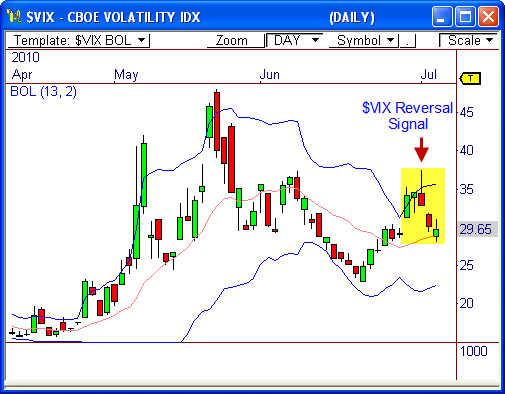
Last week, I wrote about the $VIX Reversal Signal in my post entitled “Follow the $VIX”. Well, we’ve seen the reversal in the $VIX come to fruition, but is the market ready to follow?
One look at the daily chart of the $VIX shows that another nice reversal has occurred after price closed outside the upper boundary of the Bollinger Bands indicator. As a matter of fact, price returned to the center line yesterday.
However, the market hasn’t followed the $VIX’s lead.
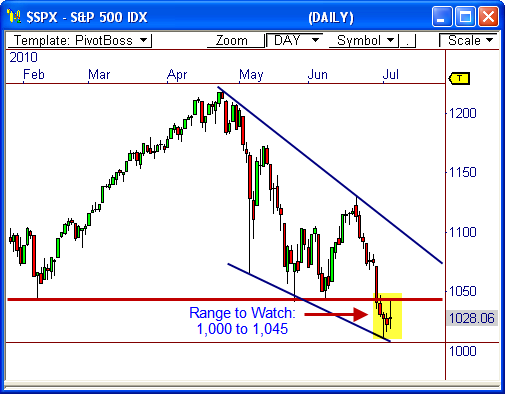
In fact, the S&P 500 Index continues to struggle at the major 1,040 level, which has been a key line in the sand for nine months.
Yesterday’s reversal off 1,040 is not a good sign for the bulls and could lead to another round of selling pressure, especially if 1,000 is taken out.
However, if the $VIX Reversal Signal holds true, and the market follows its lead, a break back above 1,040 could lead to a nice short term rally back toward 1,080 to 1,100.
Since the $SPX continues to hold above the lower trend line that has formed since the May “Flash Crash”, there is still a bullish case to be made.
Watch 1,045 for bullish confirmation. Otherwise, a failure to rise above 1,045 could lead to a very important test at 1,000 soon.
The battle lines have been drawn. Let’s see how this one plays out!
Cheers!
Frank Ochoa
PivotBoss.com
Follow Frank on Twitter: http://twitter.com/PivotBoss


