The E-Mini Russell 2000 is giving me conflicting vibes about future direction. While lower timeframes indicate a downside reversal to come, the daily chart suggests a little more upside could be seen. Let’s take a look.
The Rounded Top
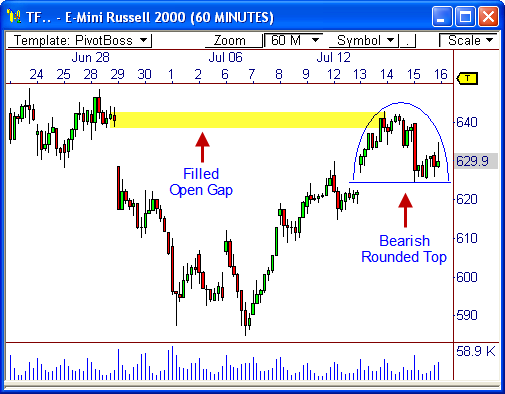
The 60-minute chart of the E-Mini Russell 2000 futures contract (TF) shows price has formed a bearish rounded top formation over the last three days of trading. This formation developed after price filled an open gap from the end of June.
Traditionally, rounded top formations indicate a bearish reversal ahead. If the lip of the pattern (support) is crossed at 624, we could see a quick drop back to the 614 area, which is basically the 50% Fibonacci retracement zone, as measured from the low to the high for the month of July.
This type of formation usually forms after price has exhausted itself from an advance. Moreover, the pattern has formed right at the upper boundary of the well-documented downtrending channel, which further reinforces the bearish tilt.
Price at H4 Resistance
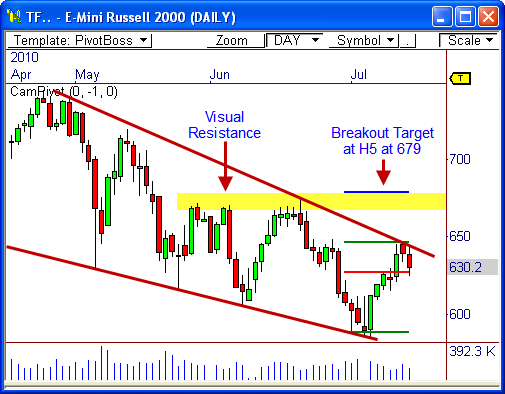
The daily chart of the TF shows price is beginning to turn down slightly from the upper boundary of the channel,which has developed since March.
The top of the channel also coincides with the H4 pivot level from the Camarilla Equation at 647. You can read more about the Camarilla Equation HERE.
The H4 pivot level is the last line of resistance for the indicator. It can lead to powerful reversals, or big breakouts. If a breakout occurs through the H4 pivot, price will usually make its way to the H5 breakout target, which is sitting at 679. This would basically coincide with visual resistance from 670 to 675, which was reached three times in the last two months.
Therefore, if the TF can break through the 647 level, which has strong resistance, we could see a move to the H5 pivot of 679, or at least 670 – not bad!
A Volume Study
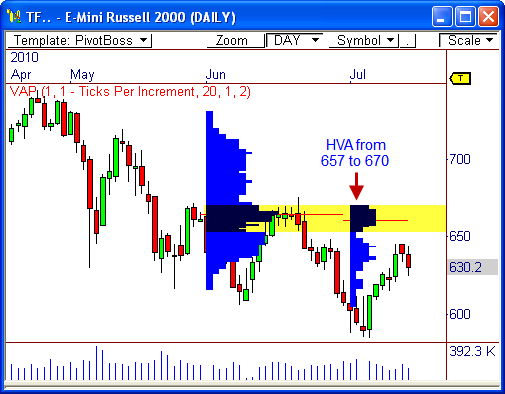
Taking at a look at the Volume at Price indicator shows the TF has formed a two-month High Volume Area (HVA) from 657 to 670, with the Volume Point of Control (VPOC) spanning from 660.60 to 664.30 the last two months.
You can read more about the Volume at Price indicator HERE.
If price does break through the H4 pivot at 647, it will likely gravitate back toward the HVA, as it did last month. That is, even if the H5 target isn’t reached at 679, there is still a very good chance that price lands somewhere between 657 and 670.
Certainly, there are conflicting views between the daily and 60-minute timeframes, but such is the life in the market.
We now have a theory to work on. Let the market prove or disprove the theory.
Let’s see what happens!
Cheers!
Frank Ochoa
PivotBoss.com
Follow Frank on Twitter: http://twitter.com/PivotBoss


