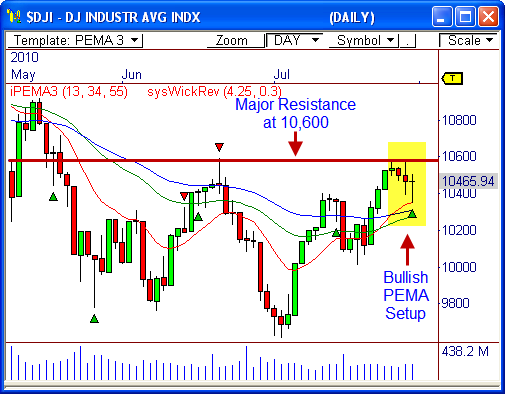
The Dow Jones Industrial Average ($DJI) has been quite bullish after rallying nearly 1,000 points from the July 2 low. However, the index looks poised for another round of buying pressure – one that could lead to the next 350 point move!
Bullish PEMA Signals
The Dow got its first bullish PEMA Crossover signal three sessions ago in the daily chart, which hasn’t happened since the March rally five months ago.
A bullish PEMA Crossover signal occurs when the 13-period pivot-based EMA crosses above the 55-period average. This is typically an indication of a shift to bullish sentiment.
As we saw with the Barrick Gold ($ABX) post on June 23, the first pull-back after a crossover signal can usually lead to a continuation move in the direction of the crossover signal.
Therefore, the Dow could see a move to 10,800 or 10,900 over the next week of trading.
However, we must see confirmation first.
A bullish close above 10,515 would confirm the PEMA Pull-Back signal.
The Dow must also contend with visual resistance at 10,600. While the current setup is bullish for the Dow, there’s strong overhead resistance. If the Dow can break through 10,600, however, a big wave of strength could be seen.
It doesn’t hurt that Friday’s daily bar is also in the form of a bullish Wick Reversal signal (hammer candlestick), which can usually lead to 3 to 4 days of follow-through.
Let’s see how this one plays out!
 By the way, the PEMA Pull-Back and the PEMA Crossover signals are included in my FREE eBook Profiting with Pivot-Based Moving Averages. If you haven’t already done so, Check it Out! It’s FREE, and I’ll never share your information.
Just enter your email address in the box below!
Cheers!
Frank Ochoa
PivotBoss.com
Follow Frank on Twitter: http://twitter.com/PivotBoss


Pingback: Breakout for the Dow | PivotBoss.com