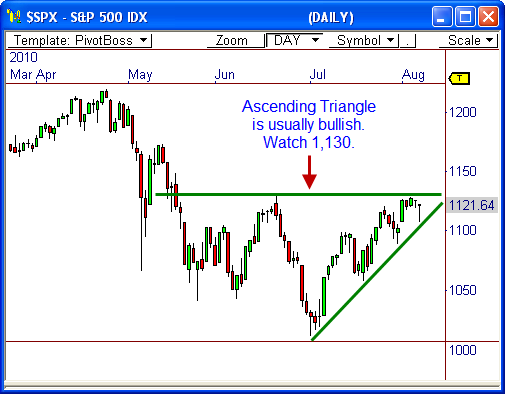
The S&P 500 has been winding up the last two months in anticipation of a larger breakout move. Well, the time has come. While a breakout in any direction could be huge, two major technical patterns indicate the breakout will be to the upside. Here’s why…
Ascending Triangle
The daily chart of the S&P 500 Index ($SPX) shows a large ascending triangle pattern has formed over the last two months. This pattern is very well-defined and it’s ascending nature historically signals an upside break. That is, a breakout usually occurs to the flat side of the pattern.
The top of the triangle also coincides with the important 1,130 resistance level, which has been a major level of interest for the market. If a breakout occurs through this zone, we could see a lot of energy released as a result, which could easily lead price back toward the next area of resistance at 1,170. Although, the triangle forecasts a 120-point move to 1,250.
Price must close the session above 1,130 in order to have confidence in upside follow-through.
The 200-day Moving Average
While I use the PEMA Method for a lot of my moving average plays, I still keep a close eye on the major moving averages that many market players follow – like the 200-day moving average.
The $SPX had been below the 200-day SMA throughout most of the last two months, but finally closed back above this important line last week – which usually signals strength.
However, the part I find especially bullish above how price reacted to the 200-day SMA occurred Friday. Notice that price sold significantly Friday morning, dropping well below the 1,115 200-day number. However, responsive participatns clearly stepped in to buy the undervalued situation that presented itself.
The buying pressure led to a major one-day reversal, which essentially created a highly bullish reversal wick candlestick, and then closed back above the 200-day average. This is extremely bullish.
Also, the fact that the 20-day SMA has already crossed above the 50-period average is also bullish, and it could become a source of support for the index.
Look for this “buy the dip” opportunity to lead to the next big wave of strength ahead. But first, price must break above 1,130.
Watch 1,105 for signs of a potential failure.
Let’s see what happens!
Cheers!
Frank Ochoa
PivotBoss.com
Follow Frank on Twitter: http://twitter.com/PivotBoss


