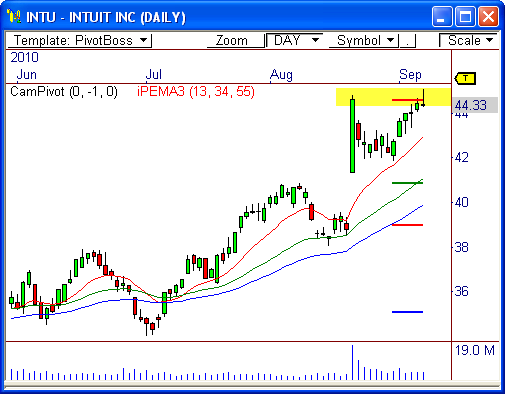
Intuit, Inc. ($INTU) has been on a highly bullish tilt since the beginning of 2009 and has accelerated its bullish pace in the last two months. However, $INTU may be on the verge of a short term pull-back that could push price back toward $42. Here’s why..
Confluence of Resistance
Price has formed a bearish shooting star candlestick pattern precisely at an area of confluence, which consists of visual and pivot-based resistance at around $45. These three factors (visual resistance, H3 pivot resistance, and the bearish candlestick) can usually lead to a high probability move in your favor.
If price cannot advance beyond $45 in the near term, look for a pull-back in this stock.
PEMA Separation
The multiple pivot-based moving averages show a wide separation between the fastest and slowest averages. This usually occurs during strong trending environments, but also indicates the potential for a retracement in price – a reversion to the mean, similar to the retracement seen in early August.
If price drops from resistance, look for a drop back toward the 34-period average, which would fall between $41 and $42. Therefore, this is a very short-term oriented opportunity.
Let’s see what happens!
Cheers!
Frank Ochoa
PivotBoss.com
Follow Frank on Twitter: http://twitter.com/PivotBoss

