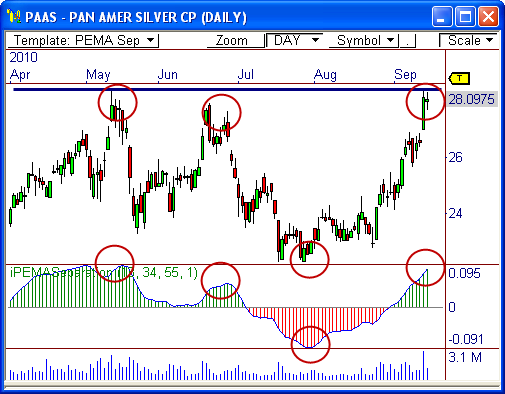
Pan American Silver ($PAAS) has been highly bullish the last six weeks of trading, rallying from $22.25 to over $28. However, this stock could be over-extended and due for a correction. Here’s why..
PEMA Separation
You folks know I like to use pivot-based moving averages for certain setups. Another way that I like to use this information is by gauging the separation between the three pivot-based EMA’s that I follow.
The PEMA Separation indicator allows me to gauge when price may be over-extended by giving me a visual representation of the distance between the various EMAs.
In the daily chart below, $PAAS seems to have reached a peak. It’s at visual resistance at $28.50 and is nearing a high on the PEMA Separation indicator. Each time the indicator has reached a vast high (or low), clear reversals in price were seen (as illustrated by the circled highlights).
Therefore, $PAAS could be on the verge of a retracement ahead, especially if price closes below yesterday’s low print of $27.69.
Yearly H3
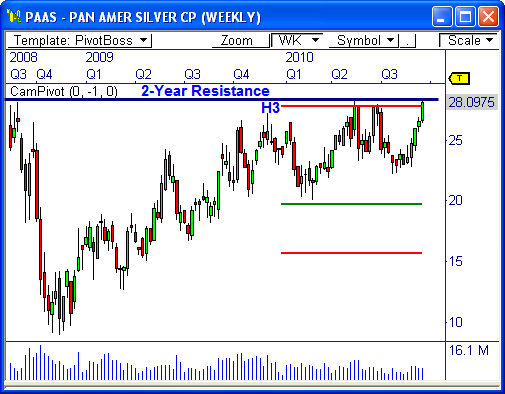
The weekly chart shows that price has also been stifled by the yearly H3 Camarilla resistance level at about $27.90, which has led to a couple retracements this year already.
Furthermore, visual resistance extends back to 2008, making this zone a prime area for potential profit-taking and short stalking.
Of course, if $29 is taken out, there’s nothing but “clear air” on the path to $37.
Let’s see how this one plays out!
Cheers!
Frank Ochoa
PivotBoss.com
Follow Frank on Twitter: http://twitter.com/PivotBoss


